Where are the Frontlines? A Visualization Approach for Map Control in Team-Based Games
Publication
Metrics
Paper Preview
Abstract
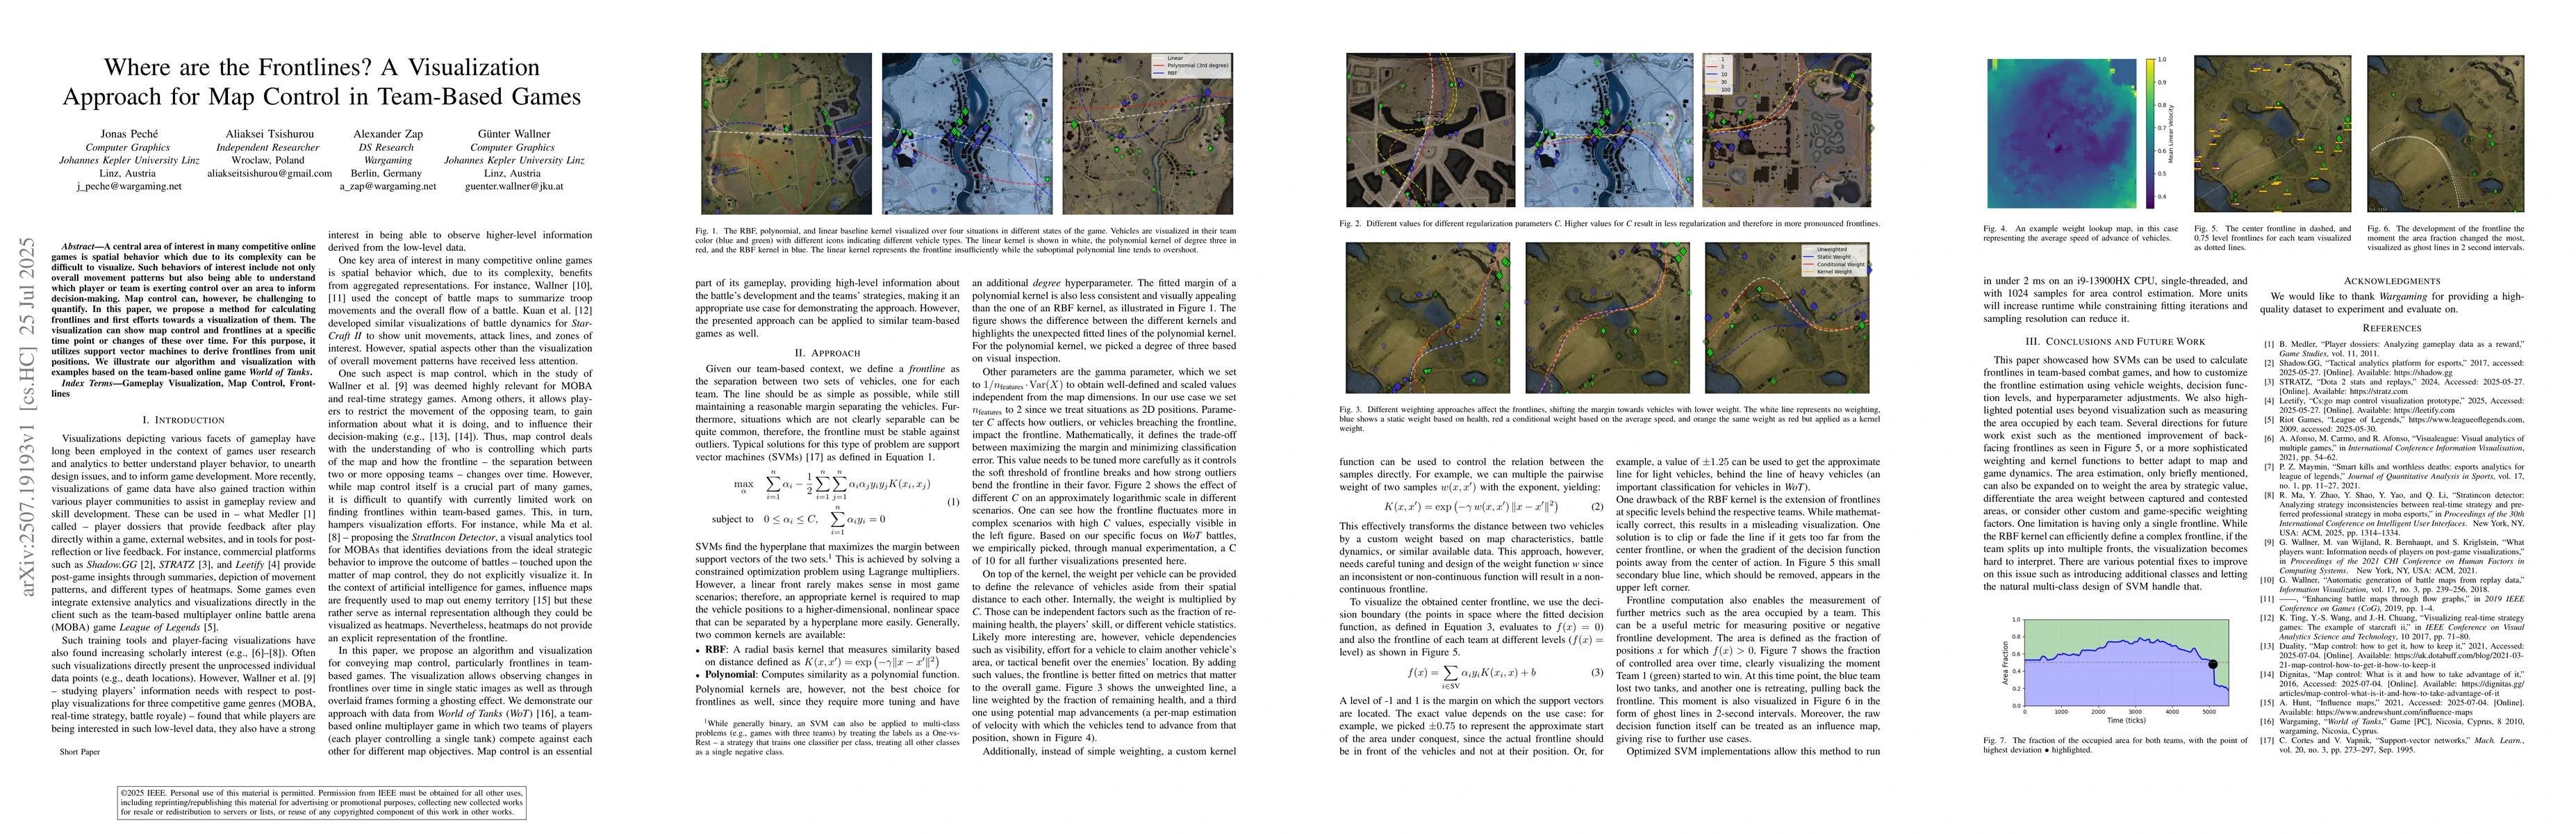
A central area of interest in many competitive online games is spatial behavior which due to its complexity can be difficult to visualize. Such behaviors of interest include not only overall movement patterns but also being able to understand which player or team is exerting control over an area to inform decision-making. Map control can, however, be challenging to quantify. In this paper, we propose a method for calculating frontlines and first efforts towards a visualization of them. The visualization can show map control and frontlines at a specific time point or changes of these over time. For this purpose, it utilizes support vector machines to derive frontlines from unit positions. We illustrate our algorithm and visualization with examples based on the team-based online game World of Tanks.
AI Key Findings
Get AI-generated insights about this paper's methodology, results, significance, and more — seven facets brought into focus.
Impact
Authors
PDF Preview
Citation Network
Current paper (gray), citations (green), references (blue)
Display is limited for performance on very large graphs.
Discussion 0