Publication
Metrics
AI Quick Summary
This paper explores the origins of thin-tailed distributions by starting with fat-tailed random variables and demonstrating how boundedness or saturation in a general dose-response curve can lead to thin-tailed outcomes. It argues that natural processes inherently limit extreme responses, resulting in thin tails despite fat-tailed inputs.
Paper Preview
Abstract
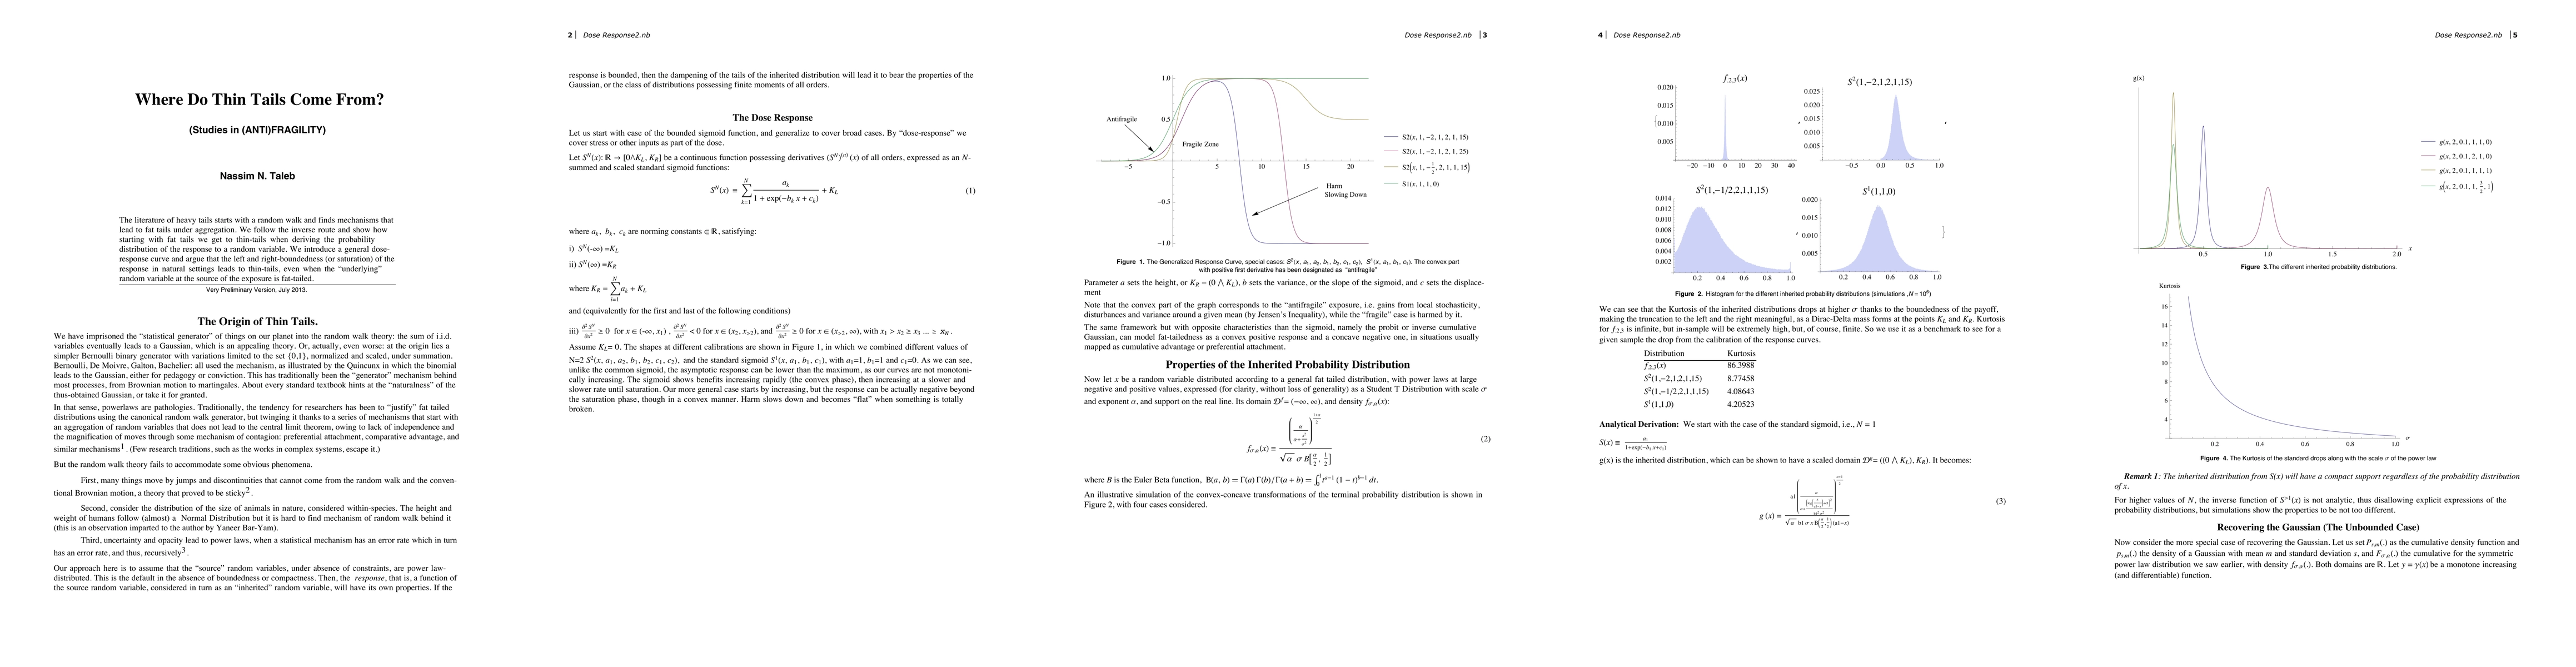
The literature of heavy tails (typically) starts with a random walk and finds mechanisms that lead to fat tails under aggregation. We follow the inverse route and show how starting with fat tails we get to thin-tails when deriving the probability distribution of the response to a random variable. We introduce a general dose-response curve and argue that the left and right-boundedness or saturation of the response in natural things leads to thin-tails, even when the "underlying" random variable at the source of the exposure is fat-tailed.
AI Key Findings
Get AI-generated insights about this paper's methodology, results, significance, and more — seven facets brought into focus.
Discussion 0