Whether the Classical O-C Diagram can be used to Multi-mode Pulsators
1504.04967
Published Apr 28, 2015
Publication
Published:
Apr 28, 2015
Updated:
Jun 02, 2025
Categories:
astro-ph.SR
Metrics
Source:
ArXiv
Paper Preview
Abstract
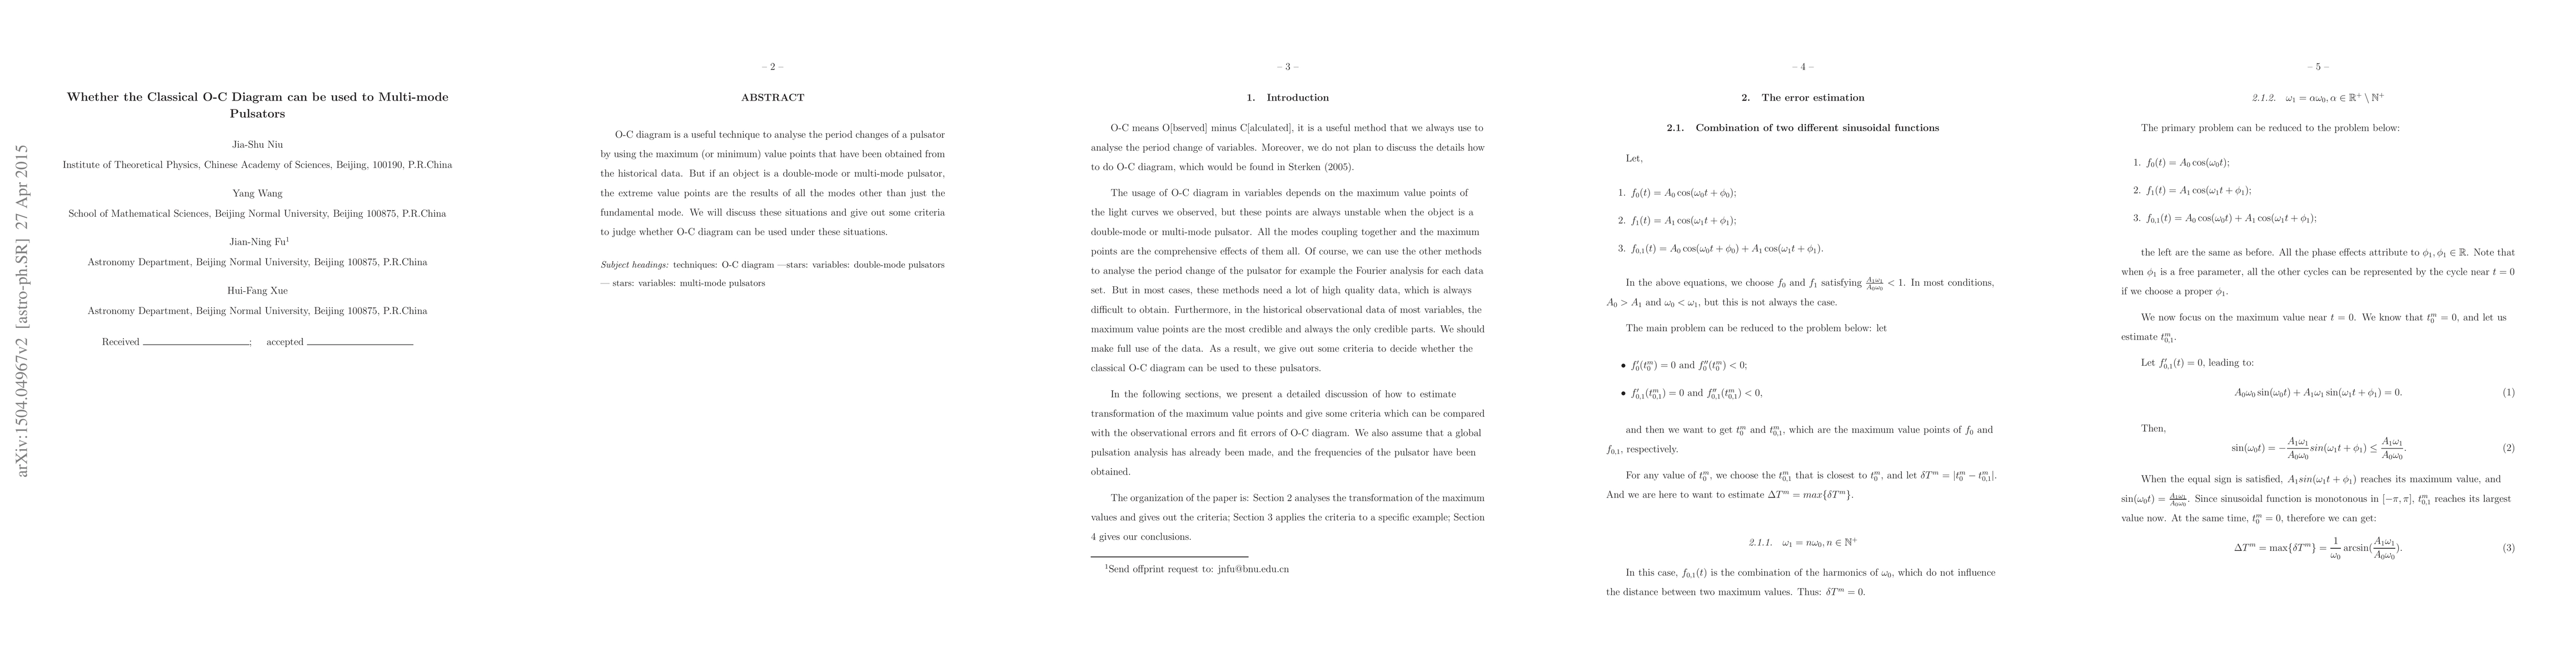
O-C diagram is a useful technique to analyse the period changes of a pulsator by using the maximum (or minimum) value points which have been obtained from the historical data. But if an object is a double-mode or multi-mode pulsator, the extreme value points are the results of all the modes other than just the fundamental mode. We discussed these situations and give out some criteria to judge whether the O-C diagram can be used in these situations.
AI Key Findings
Get AI-generated insights about this paper's methodology, results, significance, and more — seven facets brought into focus.
Paper Details
Paper ID:
1504.04967
License:
http://arxiv.org/licenses/nonexclusive-distrib/1.0/
Comments:
12 pages
Categories:
astro-ph.SR
PDF Preview
Key Terms
mode
(0.343)
situations
(0.340)
diagram
(0.303)
points
(0.254)
value
(0.232)
historical
(0.220)
criteria
(0.208)
analyse
(0.206)
Related Papers
No references found for this paper.
Discussion 0