Authors

Summary

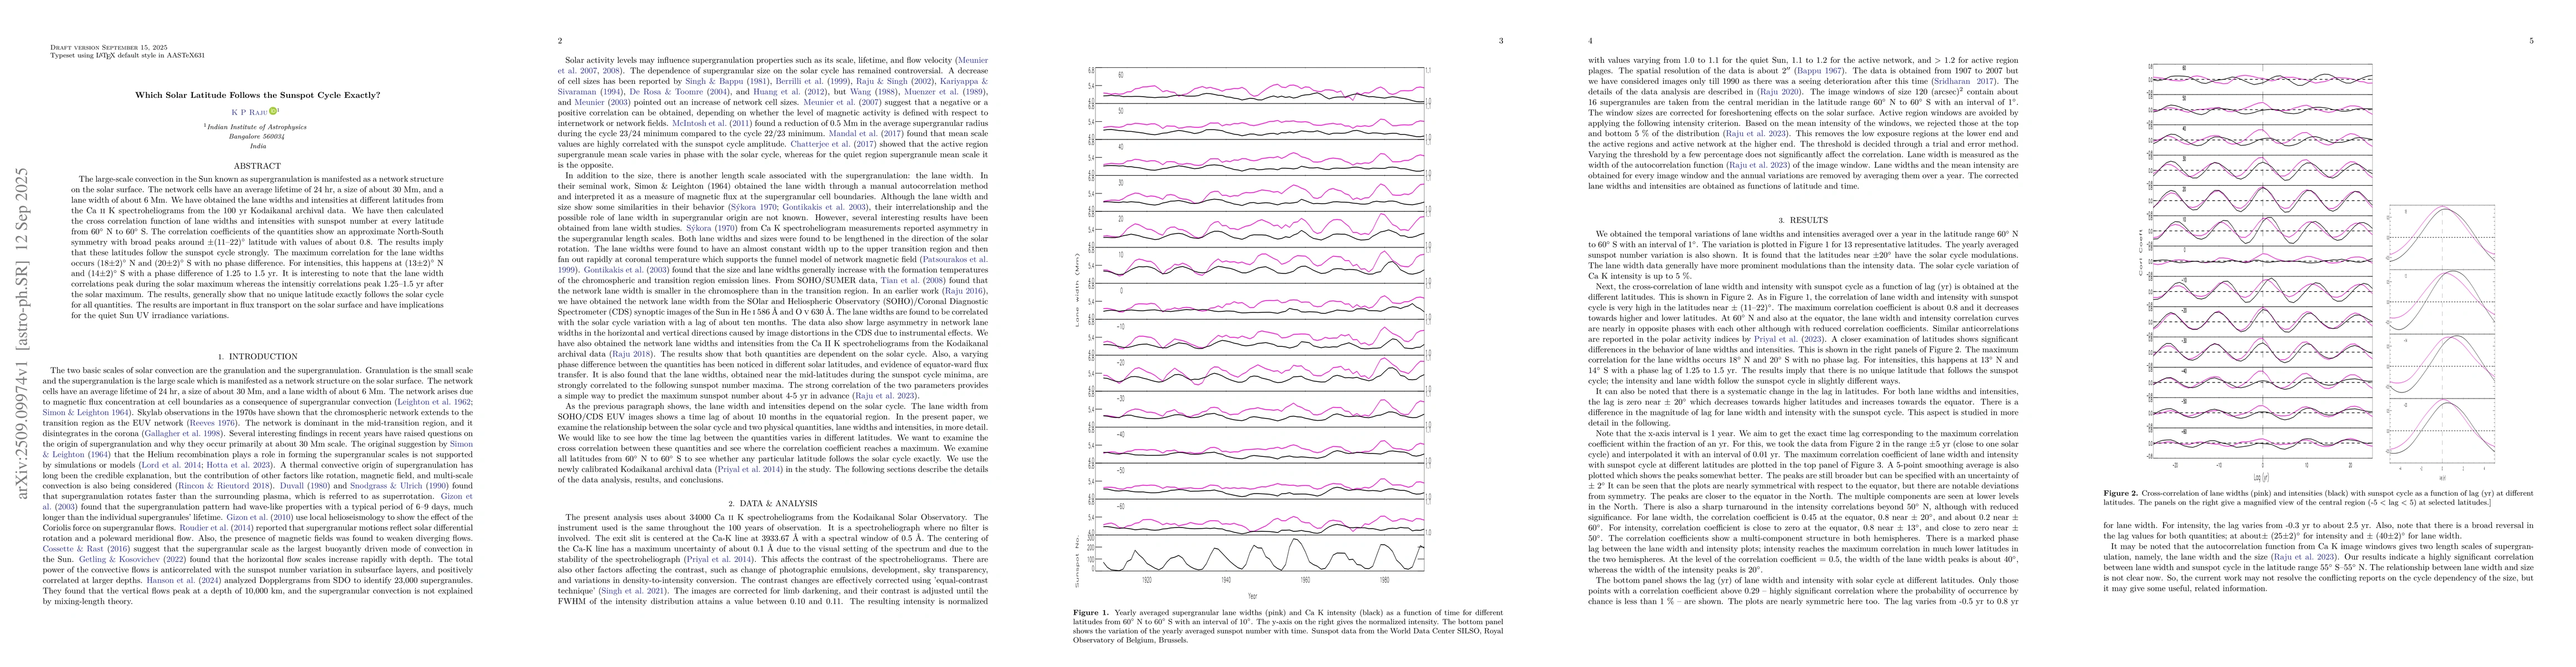
The large-scale convection in the Sun known as supergranulation is manifested as a network structure on the solar surface. The network cells have an average lifetime of 24 hr, a size of about 30 Mm, and a lane width of about 6 Mm. We have obtained the lane widths and intensities at different latitudes from the Ca {\sc ii} K spectroheliograms from the 100 yr Kodaikanal archival data. We have then calculated the cross correlation function of lane widths and intensities with sunspot number at every latitude from 60$^{\circ}$ N to 60$^{\circ}$ S. The correlation coefficients of the quantities show an approximate North-South symmetry with broad peaks around $\pm$(11--22)$^{\circ}$ latitude with values of about 0.8. The results imply that these latitudes follow the sunspot cycle strongly. The maximum correlation for the lane widths occurs (18$\pm$2)$^{\circ}$ N and (20$\pm$2)$^{\circ}$ S with no phase difference. For intensities, this happens at (13$\pm$2)$^{\circ}$ N and (14$\pm$2)$^{\circ}$ S with a phase difference of 1.25 to 1.5 yr. It is interesting to note that the lane width correlations peak during the solar maximum whereas the intensitiy correlations peak 1.25--1.5 yr after the solar maximum. The results, generally show that no unique latitude exactly follows the solar cycle for all quantities. The results are important in flux transport on the solar surface and have implications for the quiet Sun UV irradiance variations.

AI Key Findings

Generated Oct 13, 2025

Methodology

The study analyzed Ca { extsc ii} K spectroheliograms from the 100 yr Kodaikanal archival data to obtain lane widths and intensities at different latitudes. Cross correlation functions were calculated between these quantities and sunspot numbers at various latitudes.

Key Results

  • Correlation coefficients show North-South symmetry with broad peaks around ±(11--22)° latitude, with values of about 0.8.
  • Maximum correlation for lane widths occurs at (18±2)° N and (20±2)° S with no phase difference, while for intensities it occurs at (13±2)° N and (14±2)° S with a phase difference of 1.25 to 1.5 yr.
  • Lane width correlations peak during solar maximum, whereas intensity correlations peak 1.25--1.5 yr after solar maximum.

Significance

The results are important for understanding flux transport on the solar surface and have implications for quiet Sun UV irradiance variations.

Technical Contribution

The research provides a detailed analysis of solar convection patterns and their correlation with sunspot cycles using historical spectroheliogram data.

Novelty

This work uniquely examines the relationship between solar network lane widths/intensities and sunspot cycles across multiple latitudes, revealing distinct latitudinal behaviors for different quantities.

Limitations

  • No unique latitude exactly follows the solar cycle for all quantities.
  • The study focuses on specific solar quantities (lane widths and intensities) and may not account for other factors affecting the solar cycle.

Future Work

  • Investigating other solar quantities that may follow the solar cycle more precisely.
  • Exploring the relationship between solar activity and UV irradiance variations in more detail.

Paper Details

PDF Preview

Download PDF

Comments (0)

This website uses cookies to ensure you get the best experience. Learn more