Who should I trust? A Visual Analytics Approach for Comparing Net Load Forecasting Models
Publication
Metrics
AI Quick Summary
This paper introduces a visual analytics application for comparing the performance of deep-learning net load forecasting models against other benchmarks, providing insights across various timeframes and solar penetration levels. The case study demonstrates the application’s effectiveness in aiding scientists in making informed decisions and boosting trust in model performance.
Paper Preview
Abstract
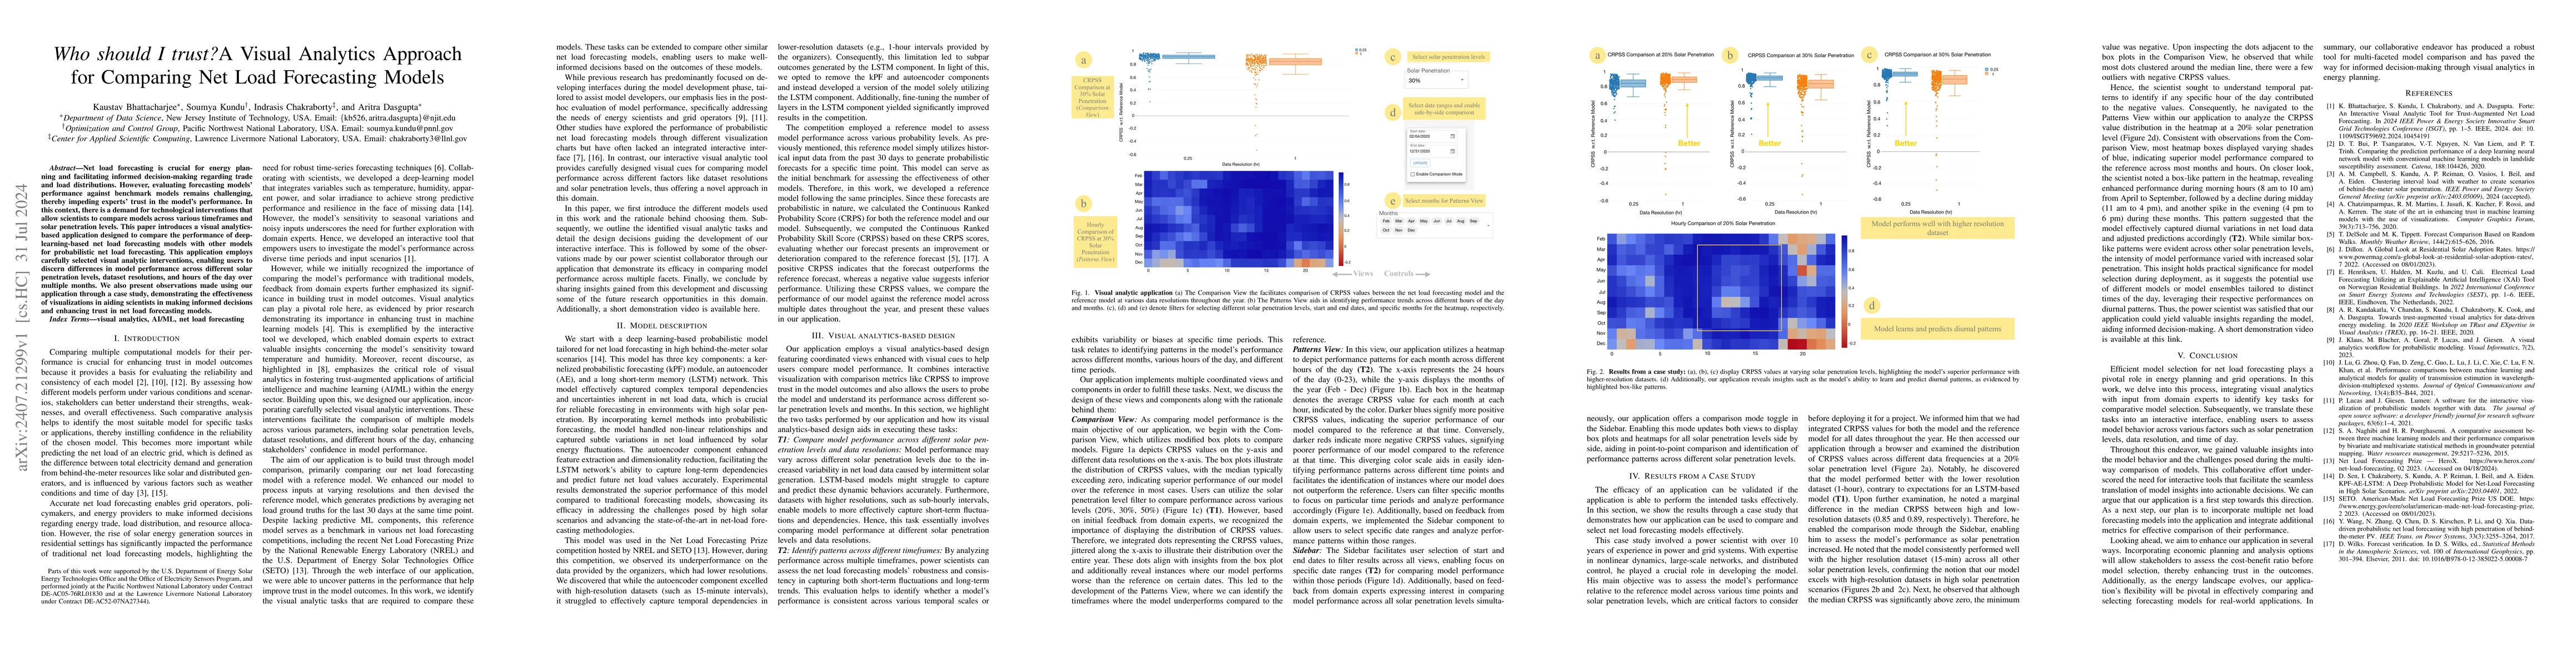
Net load forecasting is crucial for energy planning and facilitating informed decision-making regarding trade and load distributions. However, evaluating forecasting models' performance against benchmark models remains challenging, thereby impeding experts' trust in the model's performance. In this context, there is a demand for technological interventions that allow scientists to compare models across various timeframes and solar penetration levels. This paper introduces a visual analytics-based application designed to compare the performance of deep-learning-based net load forecasting models with other models for probabilistic net load forecasting. This application employs carefully selected visual analytic interventions, enabling users to discern differences in model performance across different solar penetration levels, dataset resolutions, and hours of the day over multiple months. We also present observations made using our application through a case study, demonstrating the effectiveness of visualizations in aiding scientists in making informed decisions and enhancing trust in net load forecasting models.
AI Key Findings
Get AI-generated insights about this paper's methodology, results, significance, and more — seven facets brought into focus.
Impact
Paper Details
Authors
PDF Preview
Key Terms
Citation Network
Current paper (gray), citations (green), references (blue)
Display is limited for performance on very large graphs.
Discussion 0