Why is the prediction wrong? Towards underfitting case explanation via meta-classification

Source: ArXiv

AI Quick Summary

This paper proposes a heuristic method to explain individual data points wrongly predicted by an underfitted classifier, using meta-classification. It projects faulty data into a human-readable representation to diagnose whether errors stem from a weak model or non-separable classes, and achieves over 80% accuracy in diagnosis labels.

Share: Share on X LinkedIn

Summary

In this paper we present a heuristic method to provide individual explanations for those elements in a dataset (data points) which are wrongly predicted by a given classifier. Since the general case is too difficult, in the present work we focus on faulty data from an underfitted model. First, we project the faulty data into a hand-crafted, and thus human readable, intermediate representation (meta-representation, profile vectors), with the aim of separating the two main causes of miss-classification: the classifier is not strong enough, or the data point belongs to an area of the input space where classes are not separable. Second, in the space of these profile vectors, we present a method to fit a meta-classifier (decision tree) and express its output as a set of interpretable (human readable) explanation rules, which leads to several target diagnosis labels: data point is either correctly classified, or faulty due to a too weak model, or faulty due to mixed (overlapped) classes in the input space. Experimental results on several real datasets show more than 80% diagnosis label accuracy and confirm that the proposed intermediate representation allows to achieve a high degree of invariance with respect to the classifier used in the input space and to the dataset being classified, i.e. we can learn the metaclassifier on a dataset with a given classifier and successfully predict diagnosis labels for a different dataset or classifier (or both).
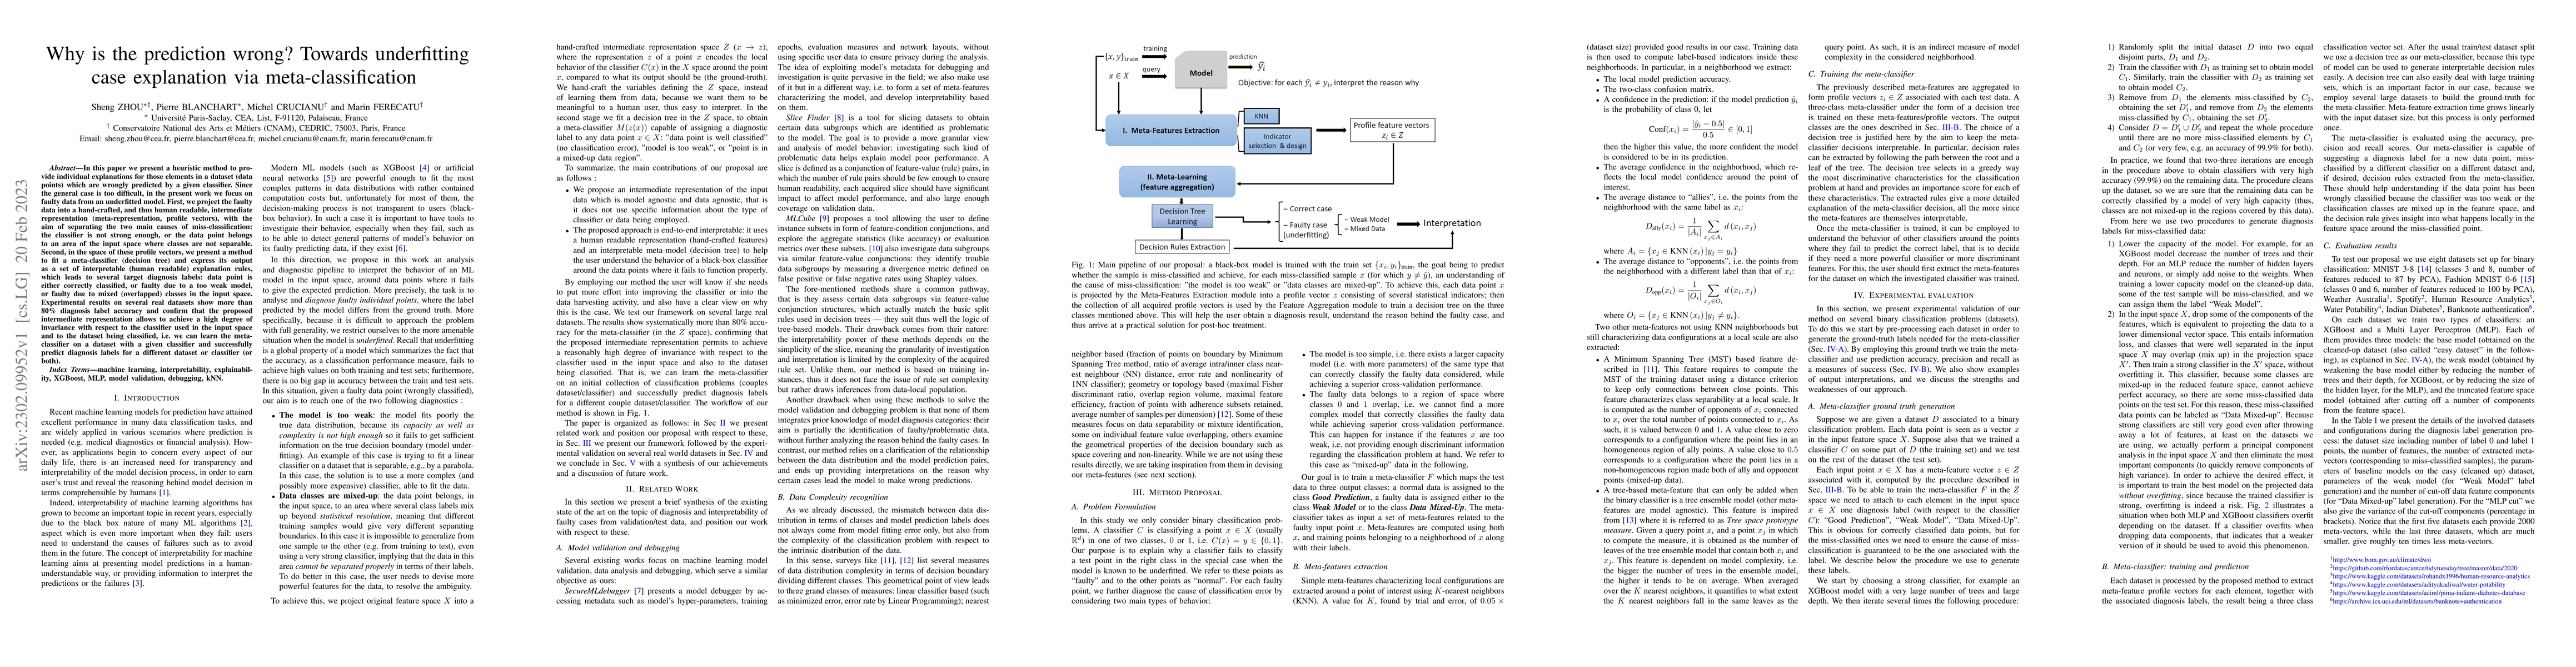
AI Key Findings

Generated Sep 03, 2025

Methodology

The paper proposes a heuristic method to provide individual explanations for misclassified data points by an underfitted model. It projects the faulty data into a human-readable intermediate representation (meta-representation, profile vectors) and fits a meta-classifier (decision tree) in this space to generate interpretable explanation rules.

Key Results

  • The proposed method achieves more than 80% diagnosis label accuracy on several real datasets.
  • The intermediate representation allows for high invariance with respect to the classifier used in the input space and the dataset being classified.

Significance

This research is significant as it helps users understand why a classifier failed to give a correct result for a given data point, aiding in debugging ML models and improving prediction accuracy and generalization.

Technical Contribution

The main technical contribution is the introduction of an intermediate representation (profile vectors) and a meta-classifier (decision tree) to provide human-readable explanation rules for misclassified data points by underfitted models.

Novelty

The novelty of this work lies in its focus on providing individual explanations for misclassified data points by underfitted models, using a human-readable intermediate representation and a meta-classifier for generating interpretable explanation rules.

Limitations

  • The method currently focuses on underfitting cases and does not address overfitting scenarios.
  • The approach is limited to binary classification problems as per the current implementation.

Future Work

  • Extend the framework to include the overfitting case, which might require a finer graduation of diagnosis scenarios.
  • Adapt the method for multi-class classification problems by updating the meta-feature list and construction of ground truth for the meta-classifier.

Paper Details

PDF Preview

Download PDF

Key Terms

classifier (0.335)
diagnosis (0.245)
meta (0.196)
dataset (0.186)
classified (0.185)
labels (0.171)
vectors (0.170)
profile (0.165)

Citation Network

Current paper (gray), citations (green), references (blue)

Display is limited for performance on very large graphs.

Current Paper
Citations
References
Click to view
Title Authors Year Actions

Comments (0)

This website uses cookies to ensure you get the best experience. Learn more