Why scatter plots suggest causality, and what we can do about it
Publication
Metrics
AI Quick Summary
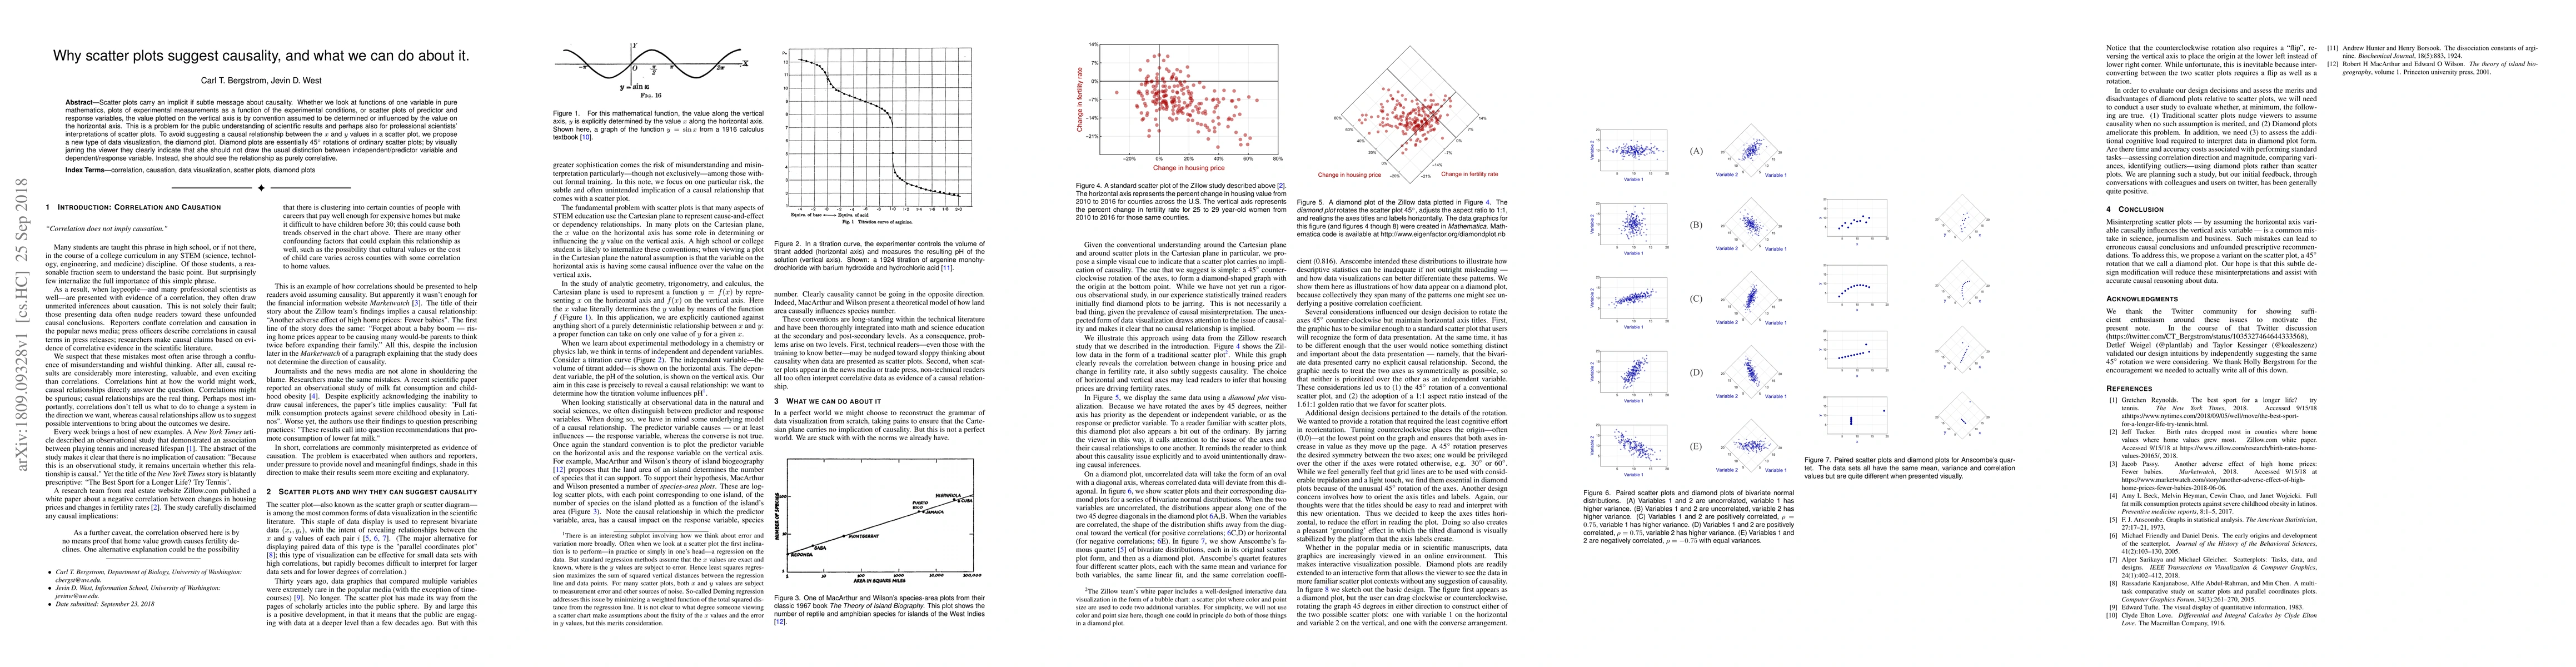
This paper discusses how scatter plots often mislead viewers into inferring causality between variables, despite their purely correlative nature. To address this, the authors propose the diamond plot, a rotated version of the scatter plot, to better convey the absence of implied causation.
Paper Preview
Abstract
Scatter plots carry an implicit if subtle message about causality. Whether we look at functions of one variable in pure mathematics, plots of experimental measurements as a function of the experimental conditions, or scatter plots of predictor and response variables, the value plotted on the vertical axis is by convention assumed to be determined or influenced by the value on the horizontal axis. This is a problem for the public understanding of scientific results and perhaps also for professional scientists' interpretations of scatter plots. To avoid suggesting a causal relationship between the x and y values in a scatter plot, we propose a new type of data visualization, the diamond plot. Diamond plots are essentially 45 degree rotations of ordinary scatter plots; by visually jarring the viewer they clearly indicate that she should not draw the usual distinction between independent/predictor variable and dependent/response variable. Instead, she should see the relationship as purely correlative.
AI Key Findings
Get AI-generated insights about this paper's methodology, results, significance, and more — seven facets brought into focus.
Impact
Paper Details
PDF Preview
Key Terms
Citation Network
Current paper (gray), citations (green), references (blue)
Display is limited for performance on very large graphs.
Discussion 0