Publication
Metrics
Paper Preview
Abstract
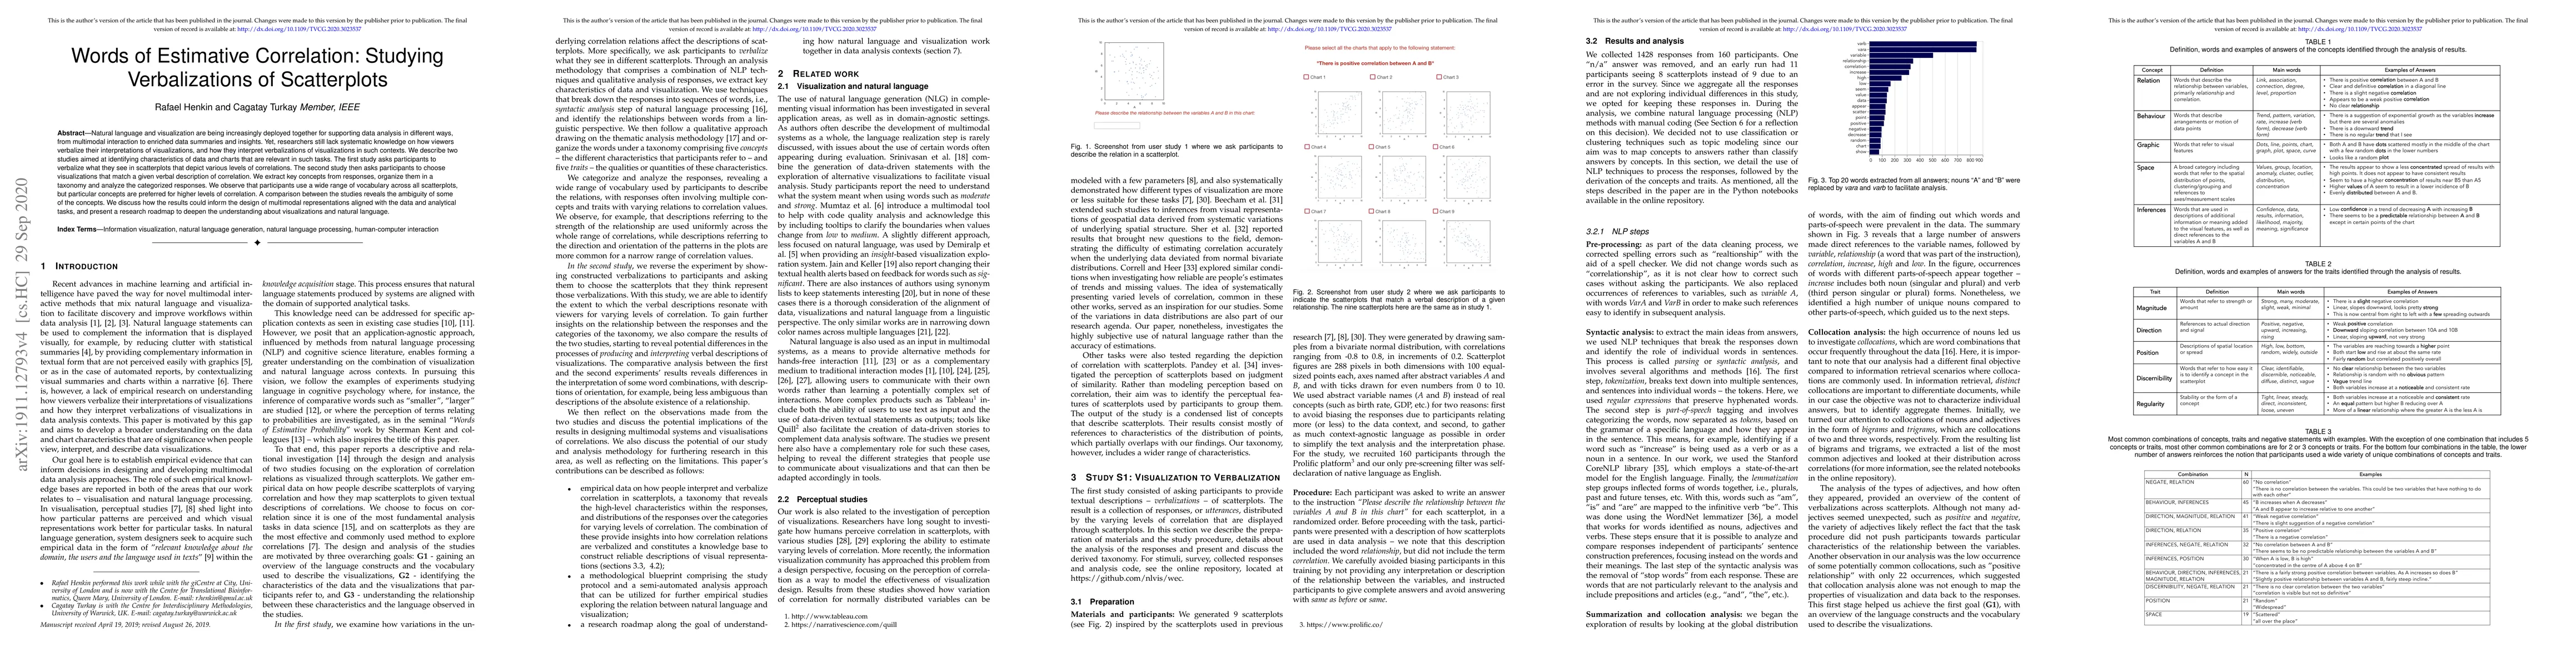
Natural language and visualization are being increasingly deployed together for supporting data analysis in different ways, from multimodal interaction to enriched data summaries and insights. Yet, researchers still lack systematic knowledge on how viewers verbalize their interpretations of visualizations, and how they interpret verbalizations of visualizations in such contexts. We describe two studies aimed at identifying characteristics of data and charts that are relevant in such tasks. The first study asks participants to verbalize what they see in scatterplots that depict various levels of correlations. The second study then asks participants to choose visualizations that match a given verbal description of correlation. We extract key concepts from responses, organize them in a taxonomy and analyze the categorized responses. We observe that participants use a wide range of vocabulary across all scatterplots, but particular concepts are preferred for higher levels of correlation. A comparison between the studies reveals the ambiguity of some of the concepts. We discuss how the results could inform the design of multimodal representations aligned with the data and analytical tasks, and present a research roadmap to deepen the understanding about visualizations and natural language.
AI Key Findings
Get AI-generated insights about this paper's methodology, results, significance, and more — seven facets brought into focus.
Impact
Paper Details
Authors
PDF Preview
Key Terms
Citation Network
Current paper (gray), citations (green), references (blue)
Display is limited for performance on very large graphs.
Discussion 0