This paper introduces worksheets designed to guide novices through the visualization design process, breaking down four high-level activities: understand, ideate, make, and deploy. The worksheets provide structured, actionable steps validated through a graduate-level course, with feedback from students suggesting areas for further improvement in visualization design pedagogy.
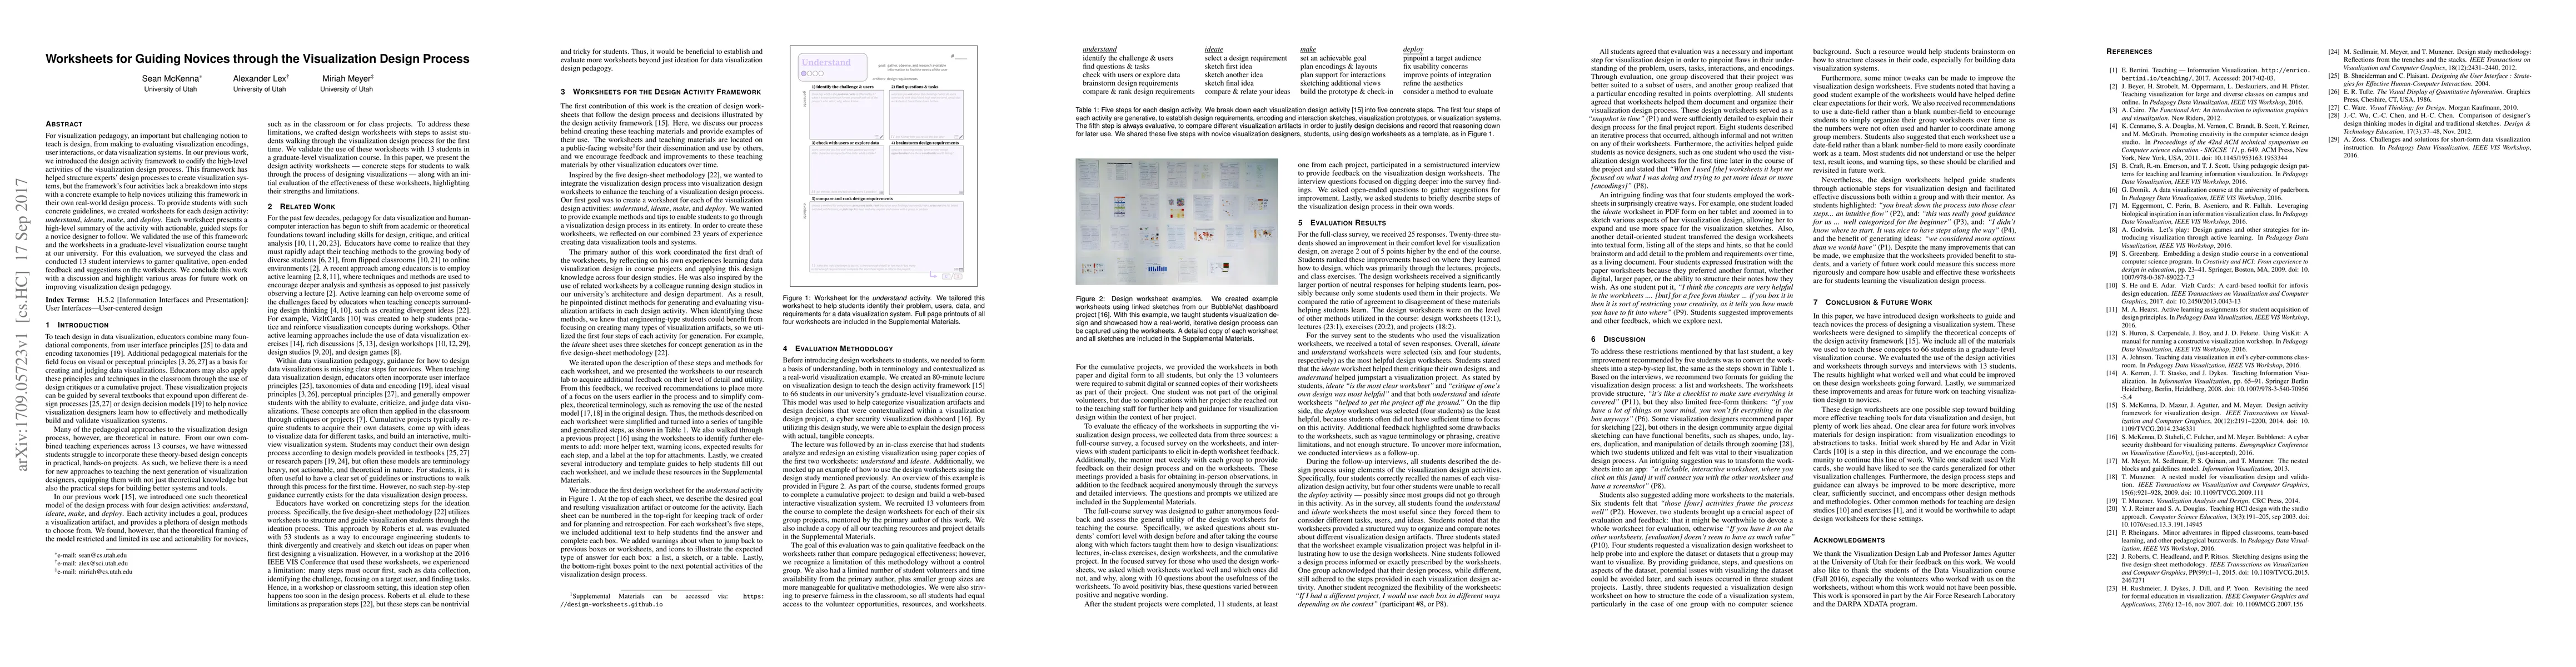
For visualization pedagogy, an important but challenging notion to teach is design, from making to evaluating visualization encodings, user interactions, or data visualization systems. In our previous work, we introduced the design activity framework to codify the high-level activities of the visualization design process. This framework has helped structure experts' design processes to create visualization systems, but the framework's four activities lack a breakdown into steps with a concrete example to help novices utilizing this framework in their own real-world design process. To provide students with such concrete guidelines, we created worksheets for each design activity: understand, ideate, make, and deploy. Each worksheet presents a high-level summary of the activity with actionable, guided steps for a novice designer to follow. We validated the use of this framework and the worksheets in a graduate-level visualization course taught at our university. For this evaluation, we surveyed the class and conducted 13 student interviews to garner qualitative, open-ended feedback and suggestions on the worksheets. We conclude this work with a discussion and highlight various areas for future work on improving visualization design pedagogy.
Get AI-generated insights about this paper's methodology, results, and significance.
Current paper (gray), citations (green), references (blue)
Matthew Berger, Shusen Liu
Sanghyun Hong, Niklas Elmqvist, Sungbok Shin
Title | Authors | Year | Actions |
---|---|---|---|
Understanding Comparative Genomics Data Visualization for Biodiversity Domain Through Persona-Based Interviews
|
Vei Siang Chan, F. Mohamed, Faezah Binti Mohd Salleh, Andres Iglesias, Najwa Ayuni Jamaludin, Ikmal Faiq Albakri
|
2024
|
View Paper |
Integrating Annotations for Sonifications and Physicalizations
|
Rhys Sorenson-Graff, S. S. Bae, Jordan Wirfs-Brock
|
2024
|
View Paper |
Process and Pitfalls of Online Teaching and Learning with Design Study “Lite” Methodology: A Retrospective Analysis
|
Uzma Haque Syeda, Cody Dunne, M. Borkin
|
2023
|
View Paper |
Communicating Consequences: Visual Narratives, Abstraction, and Polysemy in Rural Bangladesh
|
S. Sultana, Syed Ishtiaque Ahmed, Jeffrey M. Rzeszotarski
|
2023
|
View Paper |
Providing visual analytics guidance through decision support
|
Wenkai Han, Hans-Jörg Schulz
|
2023
|
View Paper |
A Data Driven Framework to Teach Visualization Design
|
Swaroop Panda, Shatarupa Thakurta Roy
|
2021
|
View Paper |
Mobile Visualization Design: An Ideation Method to Try
|
Sheelagh Carpendale, Petra Isenberg, Charles Perin, Tanja Blascheck, Foroozan Daneshzand, Alaul Islam, Katherine Currier, Peter Buk, Victor Cheung, Lien Quach, Laton Vermette
|
2021
|
View Paper |
Fixation and Creativity in Data Visualization Design: Experiences and Perspectives of Practitioners
|
Paul C. Parsons, P. Shukla, Chorong Park
|
2021
|
View Paper |
A Didactic Methodology for Crafting Information Visualizations
|
Mandy Keck, Rainer Groh, Zana Vosough
|
2020
|
View Paper |
Distributed Synchronous Visualization Design: Challenges and Strategies
|
Tatiana Losev, Sarah Storteboom, Sheelagh Carpendale, S. Knudsen
|
2020
|
View Paper |
ColVis: Collaborative Visualization Design Workshops for Diverse User Groups
|
Damla Çay, T. Nagel, A. Yantaç
|
2020
|
View Paper |
Usability of Data Visualization Activity Worksheets in the Context of a Critical Data Visualization Workshop: Findings from a Usability Survey
|
Vetria L. Byrd, Kendall Roark, Brent T. Ladd
|
2020
|
View Paper |
Leveraging Peer Feedback to Improve Visualization Education
|
Zachariah J. Beasley, A. Friedman, L. Piegl, Paul Rosen
|
2020
|
View Paper |
Sketching and Ideation Activities for Situated Visualization Design
|
Nathalie Bressa, Kendra Wannamaker, Henrik Korsgaard, Wesley Willett, Jo Vermeulen
|
2019
|
View Paper |
Teaching Data Visualization and Storytelling with Data Comic Workshops
|
Zezhong Wang, H. Dingwall, Benjamin Bach
|
2019
|
View Paper |
VisGuides: A Forum for Discussing Visualization Guidelines
|
A. Diehl, Alfie Abdul-Rahman, Mennatallah El-Assady, Benjamin Bach, D. Keim, Min Chen
|
2018
|
View Paper |
DRAFT VERSION : Sketching and Ideation Activities for Situated Visualization Design
|
Nathalie Bressa, Kendra Wannamaker, Henrik Korsgaard, Wesley Willett, Jo Vermeulen
|
2019
|
View Paper |
Making Data Visualization Design Worksheets Accessible
|
Edith Mauro, Edith Mauro
|
2019
|
View Paper |
The Design Activity Framework: Investigating the Data Visualization Design Process
|
Sean McKenna
|
2017
|
View Paper |
Comments (0)