01
MethodologyHow they did it
The research used a combination of photometric data and spectral analysis to identify obscured active galactic nuclei.
Researchers developed a method to identify heavily absorbed AGN in X-ray data using colour-colour selection, finding that 61% of a sample had NH>10^23 cm^-2, highlighting the limitations of simple hardness ratio analysis.
Researchers developed a method to identify heavily absorbed AGN in X-ray data using colour-colour selection, finding that 61% of a sample had NH>10^23 cm^-2, highlighting the limitations of simple hardness ratio analysis.
The research used a combination of photometric data and spectral analysis to identify obscured active galactic nuclei. More in Methodology →
A significant number of sources with NH > 1023 cm^-2 were detected in the soft band (0.5-2 keV) through their soft excess emission. — The hard band (2-10 keV) photon fluxes showed a clear distinction between obscured and unobscured AGN. More in Key Results →
This work provides a reliable method for detecting obscured active galactic nuclei using photometric data alone, which is essential for understanding their role in galaxy evolution. More in Significance →
The sample size was limited by the availability of high-quality spectra and photometry. — The soft band (0.5-2 keV) photon fluxes may be affected by instrumental calibration issues. More in Limitations →
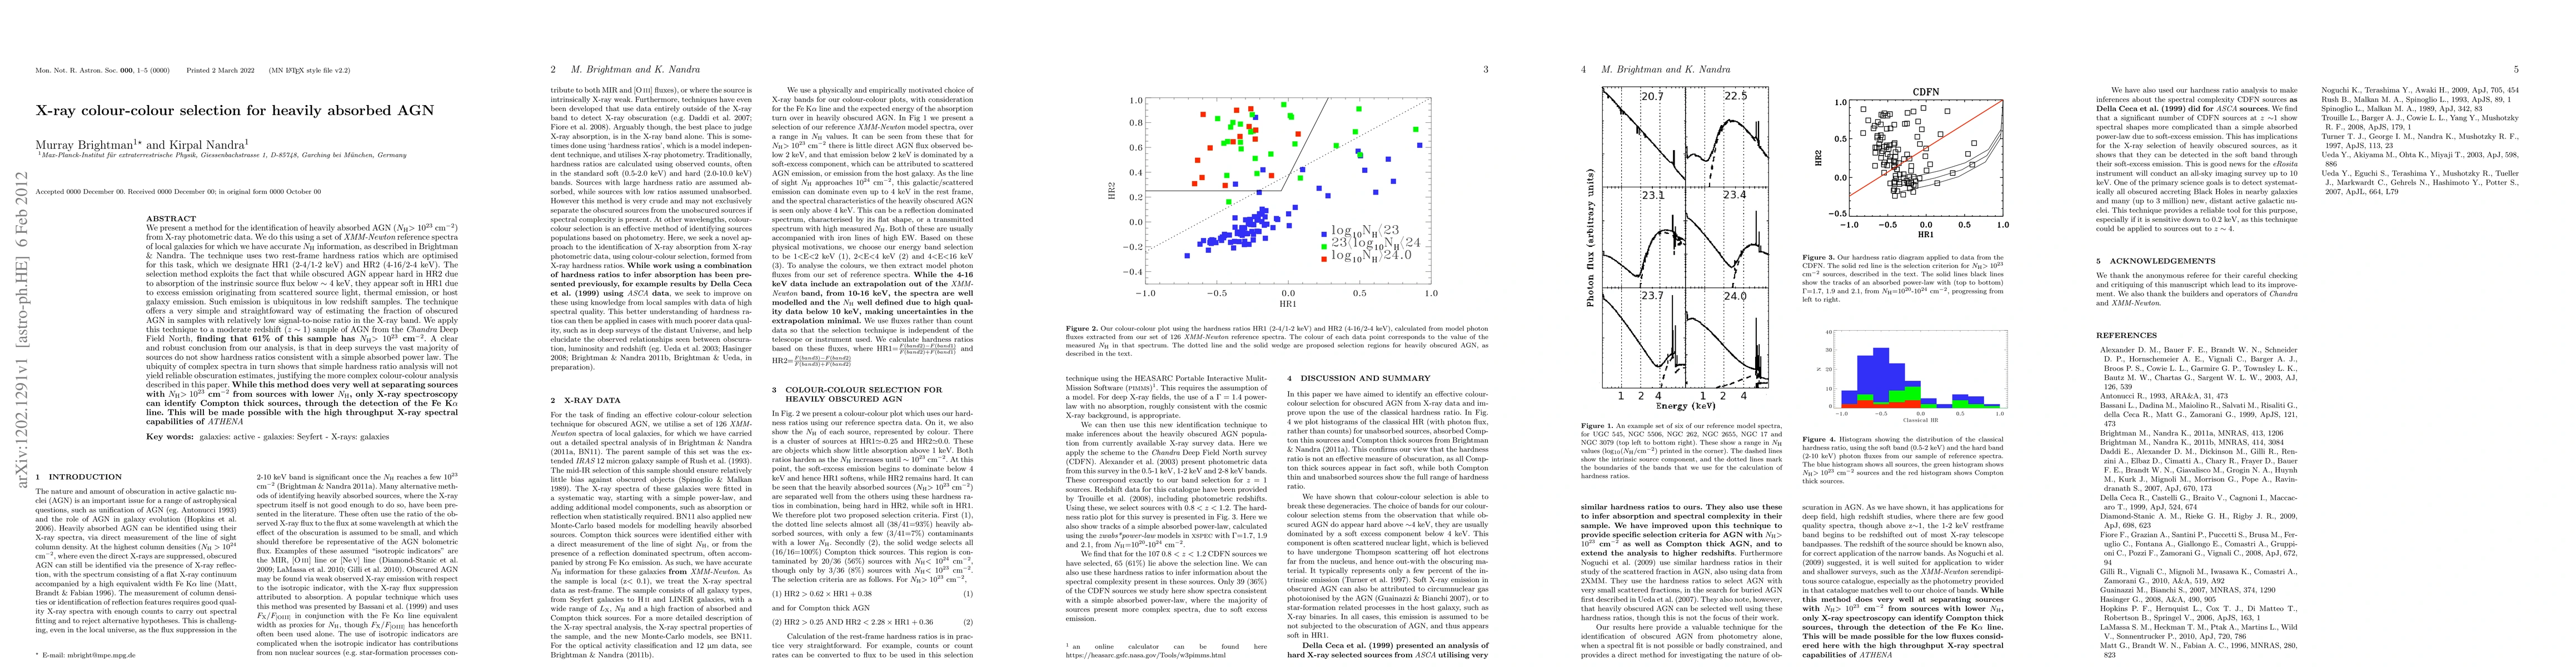
We present a method for the identification of heavily absorbed AGN (NH>10^23 cm^-2) from X-ray photometric data. We do this using a set of XMM-Newton reference spectra of local galaxies for which we have accurate NH information, as described in Brightman & Nandra. The technique uses two rest-frame hardness ratios which are optimised for this task, which we designate HR1 (2-4/1-2 keV) and HR2 (4-16/2-4 keV). The selection method exploits the fact that while obscured AGN appear hard in HR2 due to absorption of the intrinsic source flux below ~4 keV, they appear soft in HR1 due to excess emission originating from scattered source light, thermal emission, or host galaxy emission. Such emission is ubiquitous in low redshift samples. The technique offers a very simple and straight forward way of estimating the fraction of obscured AGN in samples with relatively low signal-to-noise ratio in the X-ray band. We apply this technique to a moderate redshift (z~1) sample of AGN from the Chandra Deep Field North, finding that 61% of this sample has NH> 10^23 cm^-2. A clear and robust conclusion from our analysis, is that in deep surveys the vast majority of sources do not show hardness ratios consistent with a simple absorbed power-law. The ubiquity of complex spectra in turn shows that simple hardness ratio analysis will not yield reliable obscuration estimates, justifying the more complex colour-colour analysis described in this paper. While this method does very well at separating sources with NH> 10^23 cm^-2 from sources with lower NH, only X-ray spectroscopy can identify Compton thick sources, through the detection of the Fe Ka line. This will be made possible with the high throughput X-ray spectral capabilities of ATHENA.
Seven facets of this paper, analysed and brought into focus by AI.
This work provides a reliable method for detecting obscured active galactic nuclei using photometric data alone, which is essential for understanding their role in galaxy evolution.
The research used a combination of photometric data and spectral analysis to identify obscured active galactic nuclei.
This work provides a reliable method for detecting obscured active galactic nuclei using photometric data alone, which is essential for understanding their role in galaxy evolution.
The development of a novel method for detecting obscured AGN using photometric data alone, which relies on the detection of soft excess emission.
This work presents a new approach to identifying obscured active galactic nuclei, which has implications for our understanding of galaxy evolution and the role of AGN in shaping their environments.
Current paper (gray), citations (green), references (blue)
Display is limited for performance on very large graphs.
Discussion 0