Publication
Metrics
AI Quick Summary
This paper introduces a comprehensive benchmark for evaluating visual explanations in AI, addressing the lack of standardized metrics. It includes eight datasets with human annotations and a pipeline for generating and assessing visual explanations, facilitating fair comparisons of existing methods. The authors benchmarked eight visual explanation methods using various alignment and causality metrics.
Paper Preview
Abstract
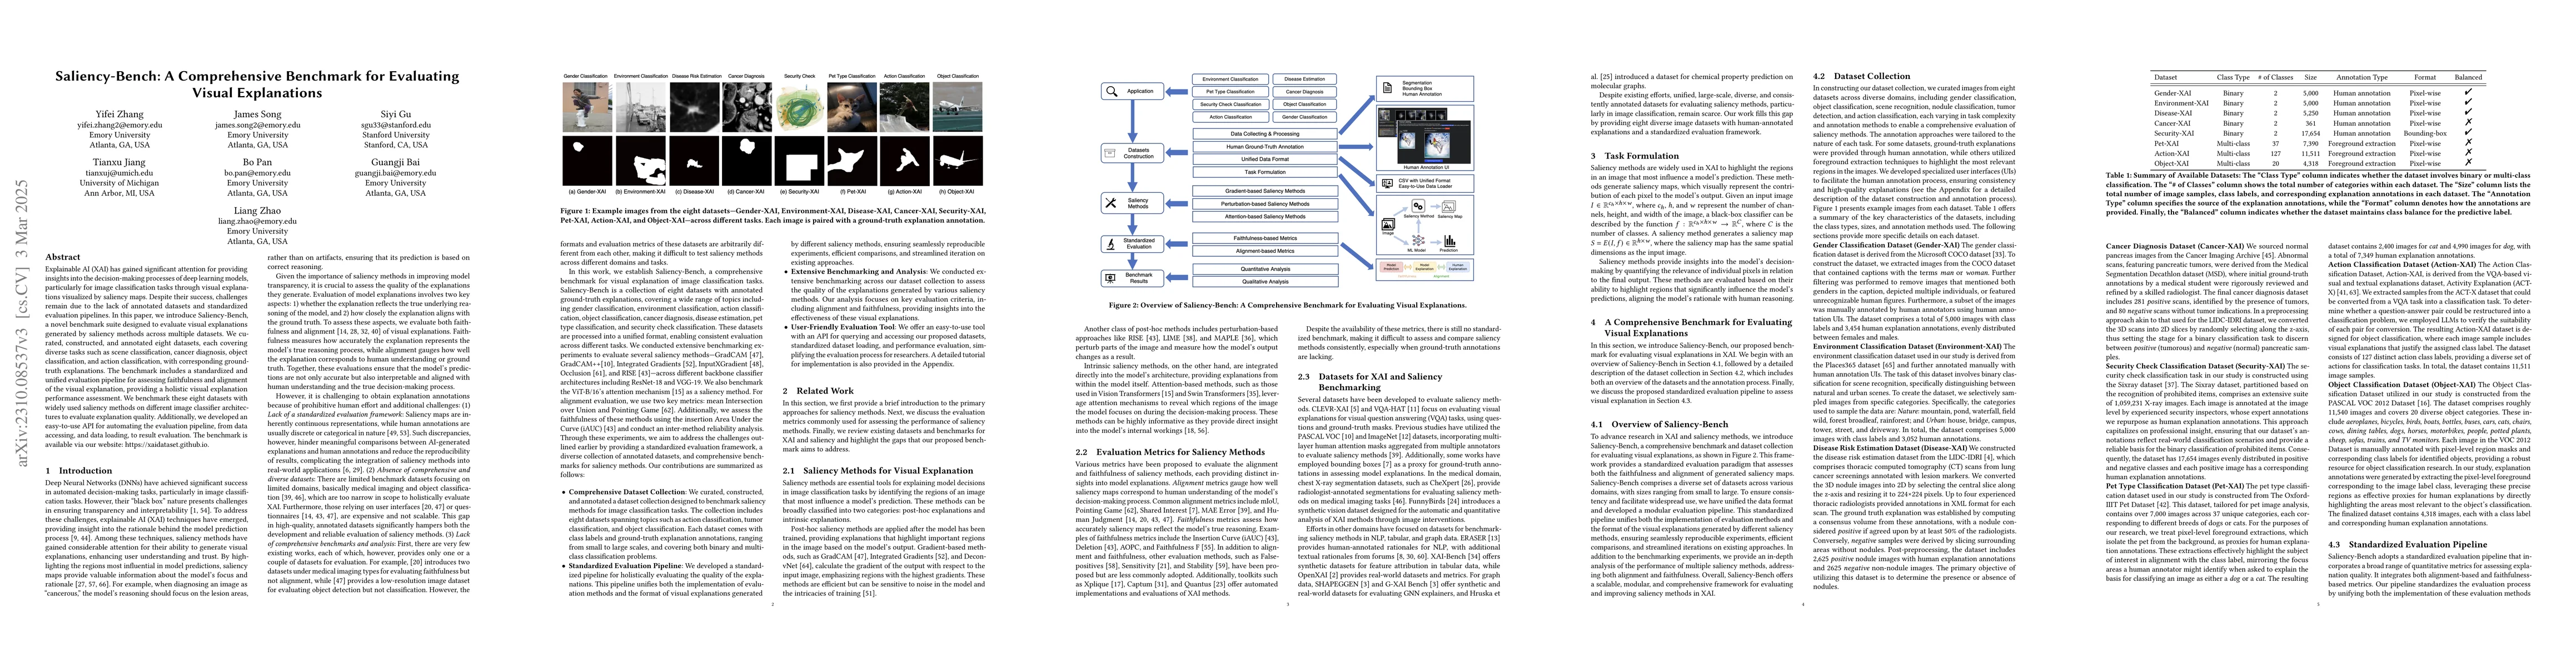
The rise of deep learning has ushered in significant progress in computer vision (CV) tasks, yet the "black box" nature of these models often precludes interpretability. This challenge has spurred the development of Explainable Artificial Intelligence (XAI) by generating explanations to AI's decision-making process. An explanation is aimed to not only faithfully reflect the true reasoning process (i.e., faithfulness) but also align with humans' reasoning (i.e., alignment). Within XAI, visual explanations employ visual cues to elucidate the reasoning behind machine learning models, particularly in image processing, by highlighting images' critical areas important to predictions. Despite the considerable body of research in visual explanations, standardized benchmarks for evaluating them are seriously underdeveloped. In particular, to evaluate alignment, existing works usually merely illustrate a few images' visual explanations, or hire some referees to report the explanation quality under ad-hoc questionnaires. However, this cannot achieve a standardized, quantitative, and comprehensive evaluation. To address this issue, we develop a benchmark for visual explanation, consisting of eight datasets with human explanation annotations from various domains, accommodating both post-hoc and intrinsic visual explanation methods. Additionally, we devise a visual explanation pipeline that includes data loading, explanation generation, and method evaluation. Our proposed benchmarks facilitate a fair evaluation and comparison of visual explanation methods. Building on our curated collection of datasets, we benchmarked eight existing visual explanation methods and conducted a thorough comparison across four selected datasets using six alignment-based and causality-based metrics. Our benchmark will be accessible through our website https://xaidataset.github.io.
AI Key Findings
Get AI-generated insights about this paper's methodology, results, significance, and more — seven facets brought into focus.
Impact
Paper Details
Authors
PDF Preview
Key Terms
Citation Network
Current paper (gray), citations (green), references (blue)
Display is limited for performance on very large graphs.
Discussion 0