Authors
Summary
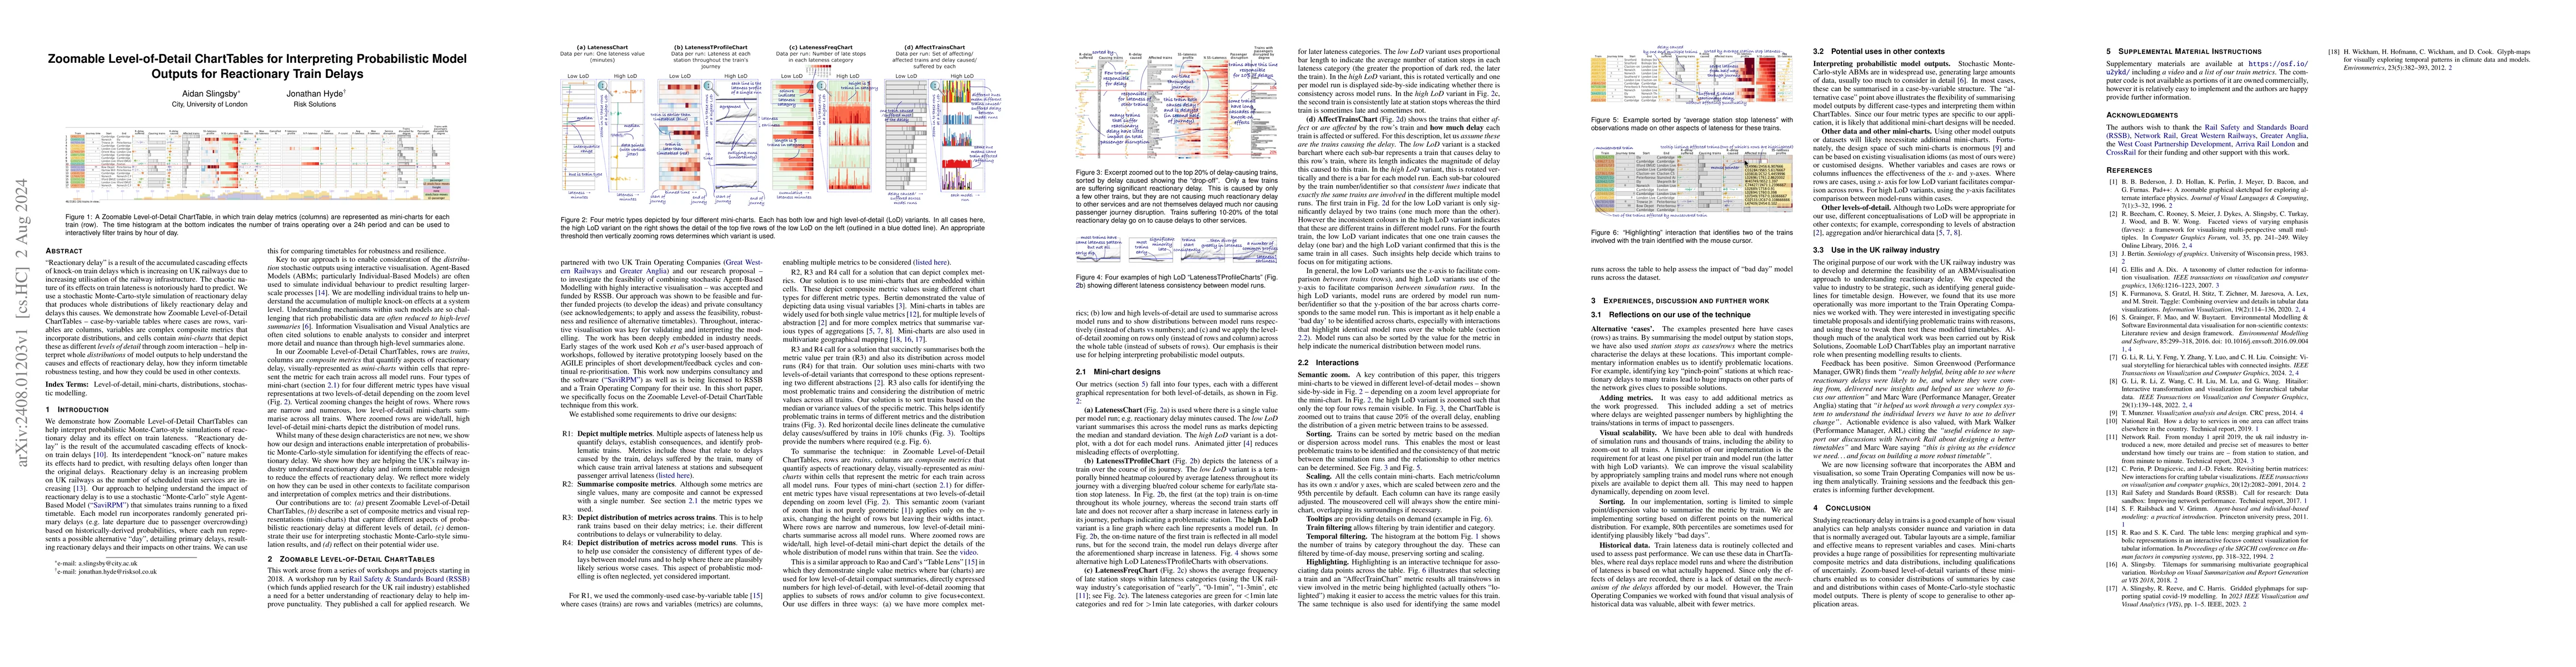
"Reactionary delay" is a result of the accumulated cascading effects of knock-on train delays which is increasing on UK railways due to increasing utilisation of the railway infrastructure. The chaotic nature of its effects on train lateness is notoriously hard to predict. We use a stochastic Monte-Carto-style simulation of reactionary delay that produces whole distributions of likely reactionary delay and delays this causes. We demonstrate how Zoomable Level-of-Detail ChartTables - case-by-variable tables where cases are rows, variables are columns, variables are complex composite metrics that incorporate distributions, and cells contain mini-charts that depict these as different levels of detail through zoom interaction - help interpret whole distributions of model outputs to help understand the causes and effects of reactionary delay, how they inform timetable robustness testing, and how they could be used in other contexts.
AI Key Findings
Get AI-generated insights about this paper's methodology, results, and significance.
Paper Details
PDF Preview
Citation Network
Current paper (gray), citations (green), references (blue)
Display is limited for performance on very large graphs.
Similar Papers
Found 4 papersProbabilistic modeling of delays for train journeys with transfers
Nikolaus Stratil-Sauer, Nils Breyer
Statistical learning for train delays and influence of winter climate and atmospheric icing
Jianfeng Wang, Jun Yu, Roberto Mantas Nakhai
Interpreting Attention Layer Outputs with Sparse Autoencoders
Arthur Conmy, Neel Nanda, Connor Kissane et al.
No citations found for this paper.
Comments (0)