Contents
1302.4959
Display of Information for Time-Critical Decision Making
Eric Horvitz
Decision Theory Group Microsoft Research Redmond, Washington 98025
Abstract
We describe methods for managing the com plexity of information displayed to people responsible for making high-stakes, time critical decisions. The techniques provide tools for real-time control of the configura tion and quantity of information displayed to a user, and a methodology for designing flexible human-computer interfaces for mon itoring applications. After defining a proto typical set of display decision problems, we introduce the expected value of revealed in formation (EVRI) and the related measure of expected value of displayed information (EVDI). We describe how these measures can be used to enhance computer displays used for monitoring complex systems. We moti vate the presentation by discussing our ef forts to employ decision-theoretic control of displays for a time-critical monitoring appli cation at the NASA Mission Control Center in Houston.
1 INTRODUCTION
The rapid growth in the use of computers to ac cess information and to monitor complex systems has brought increased attention to the costs of navigating through large quantities of data in search of critical information. Problems with accessing and reviewing information are especially salient in high-stakes, time critical decision-making contexts. We present work on enhancing the human-computer interface through ap plying decision-theoretic inference to control the infor mation displayed to people responsible for monitoring complex systems. The methods can be employed to enhance the quality and timeliness of decisions by ad justing the configuration and quantity of information displayed to decision makers, depending on the current uncertainties and time criticality. Beyond their appli cation in the real-time control displays, the techniques
· Current address: Rockwell Space Operations Com pany, Mail Code R20A-4, 600 Gemini, Houston, TX 77058.
Matthew Barry•
Propulsion Systems Section NASA Johnson Space Center Houston, Texas 77058 [email protected] can also assist engineers with the offline design of user interface content and functionality. We will see also how a decision-theoretic perspective on display high lights important questions about human information processing. Answers to these questions will allow us to further refine the display-management methodology.
Previous related investigation of the use of prob ability and utility in display management includes work on controlling the tradeoff between the com pleteness and the complexity of informational displays, computer-based explanations, and computational be havior [Horvitz et al., 1989], the use of multiattribute utility to control the complexity of presentations and displays [Horvitz, 1987a, Mclaughlin, 1987], and mul tiattribute utility for queuing and prioritizing the re sults of diagnostic reasoning [Breese et al., 1991]. In other related work, qualitative models, in combination with several heuristic importance metrics have been employed to select information for monitoring appli cations [Doyle et al., 1989].
We will first review basic results from studies of human information processing about cognitive load, short term memory, and decision making. Then, we will de scribe the representation and solution of time-critical decision problems. We will introduce the task of mon itoring and decision making about propulsion systems on the Space Shuttle to motivate the importance of in formation display in time-critical situations. We will present decision models for the display of information, and discuss methods for evaluating the value of dis played information. We will focus first on the expected value of revealed information (EVRI). After, we will introduce the use of Bayesian models of user belief and action, and describe the expected value of displayed information (EVDI). Finally, we will address practical approaches to implementing display managers based on EVRI and EVDI. We will summarize by discussing our research directions.
2 INFORMATION AND COGNITIVE LIMITATIONS
Why should we worry about managing the complexity of displayed information? Decision-theoretic analyses
of the value of information show us that gaining cost free access to additional information can only enhance the quality of our actions. Unfortunately, information often comes at a cost. When we compute the net value of information, we consider the value of information, given uncertainty about test results, and the cost of information.
Information that is already available to a computer about a monitored system typically does not cost any thing to display. However, in time-critical, high�stakes situations, the time required by people to review infor mation, and confusion arising in attempts to process large amounts of data quickly, can lead to costly delays and errors.
Fundamental limitations in the abilities of people to process information explain why decision quality may degrade with increases in the quantity and complex ity of data being reviewed, and with diminishment in the time available for a response. Human diffi culties with the processing of information has been a key research focus within Cognitive Psychology [Bruner et a!., 1956]. Numerous studies have provided evidence that human information processing is pri marily sequential in nature [Simon, 1972]. Experi ments have shown that the speed at which subjects perform tasks drops as the quantity of information being considered increases, and that the rate of per forming tasks can be increased by filtering or sup pressing irrelevant information [Morrin et al., 1961]. In a classic study on limitations in human cognition, Miller found that humans cannot consider more than five to nine distinct concepts or "chunks" of informa tion simultaneously [Miller, 1956]. The capacity of decision makers to consider important influences on a decision may be reduced even further if fast ac tion is demanded in crisis situations. One cognitive psychology study demonstrated that people cannot retain and reason simultaneously about more than two concepts in environments filled with distractions [Waugh and Norman, 1965]. These and other cogni tive psychology findings provide motivation for auto mated methods that can balance the value and costs of displayed information.
3 TIME-CRITICAL DECISIONS
The costs versus the benefits of spending time to re view additional information are sensitive to the time criticality of a situation. In time-critical contexts, the utilities of outcomes diminish significantly with delays in taking appropriate action. There are sev eral classes of time-dependent decision problems and a variety of ways to represent variables and proba bilistic dependencies to encode knowledge about time dependence of outcome and utility [Horvitz, 1987b, Horvitz, 1988]. In one approach, we model explicitly the time-dependent progression of important states of a system under the influence of processes that may per sist over time. We consider the effects of different ac tions (including not taking any explicit action) at dif-
ferent times on the temporal progression of the states of a system. In some cases, it may be appropriate to assess an outcome as an equilibrium state, reached at some time following a set of interventions, and to as sess the utility of this equilibrium state [Horvitz, 1990]. We can attempt to minimize the detailed modeling of the temporal progression of system states by assessing the time-dependent changes in the utility of outcomes that are defined in terms of a system (or world) state and interventions made at various times. The utility associated with allowing one or more states of a system to evolve with or without intervention is a function of the state, the action, and the time action is taken. It may be possible to assess from experts time-dependent utility functions that capture the changes in utility at progressively later times of intervention for different system states [Horvitz and Rutledge, 1991].
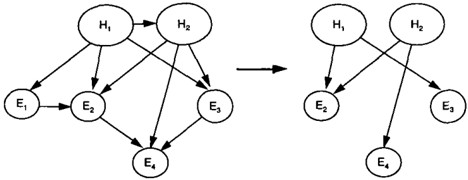
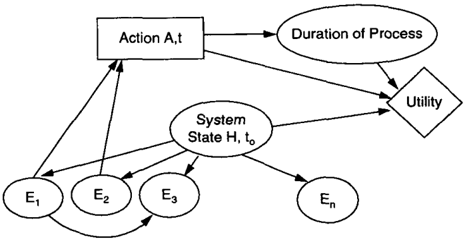
In one class of time-critical decision problem, repre senting a large class of high-stakes, time-critical moni toring tasks, we gain access to information about sys tem's behavior at time t0 and attempt to diagnose and take action to respond to the anomalous state of the system. In many time-critical situations, additional in formation about the progression of a state over time is either not relevant or not available before action needs to be taken. Outcomes are often particularly sensitive to the length of time that an anomalous condition per sists. Delays may be associated with significant time dependent changes in the utility of outcomes based in the duration of the condition. A representation of this type of decision problem, assuming a single action or fixed sequence of actions, is represented by the influ ence diagram in Figure 1. We assess time-dependent utilities, as a function of the action A;, the state of the system Hj, and the delay before action is taken, u(A;, Hi, t). Given uncertainty about the state of sys tem, the expected utility (EU) of taking action A; at timet is
where p(Hj IE, e) lS the probability over hypotheses
about different systems states, given observations E and background state of information �.
4 EXAMPLE: SPACE SHUTTLE PROPULSION SYSTEMS
Our work on display management for time-critical decisions has been a key component of the multi site Vista Project [Horvitz et al., 1992]. The Vista Project was initiated in 1991 to develop inferential tools to assist flight engineers at the NASA Mission Control Center in Houston with the interpretation of telemetry from the Space Shuttle. We designed and implemented decision-theoretic inference and display management software to aid engineers monitoring the Shuttle's propulsion systems. To further motivate display-management issues, we will review some detail about the propulsion-systems monitoring and decision problem.
Flight engineers in the Propulsion Section at Johnson Space Center are responsible for monitoring two differ ent Shuttle thruster systems: the orbital maneuvering system (OMS) and the reaction control system (RCS). The large right and left OMS engines are fired for such critical maneuvers as orbital insertion and orbit circu larization. The smaller suites of RCS thrusters are used for translation in space, for such tasks as maneu vering near objects in orbit, as well as for the continual computer-controlled stabilization of the Shuttle's tra jectory and position.
Flight engineers often face a large quantity of poten tially relevant information, especially during crises. Propulsion flight engineers must continue to moni tor multiple sensors which measure such variables as changes in the Shuttle's velocity with burns, pressures and temperatures in tanks of consumables (helium, fuel, nitrogen, and oxidizer), and voltages and currents in electrical subsystems.
If a problem with the functioning of the propulsion sys tems is noted during a critical burn, the operator must decide whether to continue the burn, halt the burn, or
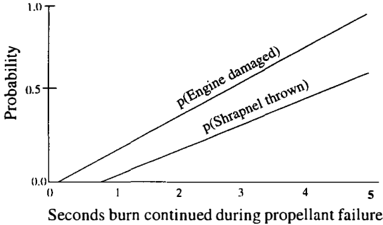
redirect fuel to alternative engines in a variety of dif ferent ways. The stakes may be high. For example, continuing a burn during an engine problem can de stroy the engines or the entire Space Shuttle. Halting a burn before a critical target velocity is reached can lead to such situations as the forced ditching of the or biter in the ocean, or the missing of a critical key reen try opportunity. Decisions are not only high-stakes, they may also be time critical. In many contexts, de layed decisions can be very costly to the mission and to the orbitor itself. The time criticality of propulsion systems decision making is highlighted by the graph in Figure 2, displaying dynamic probabilities, assessed from an expert, of damaging and destroying an engine explosively by continuing a burn during a propellant failure.
4.1 STATUS QUO FOR DISPLAY
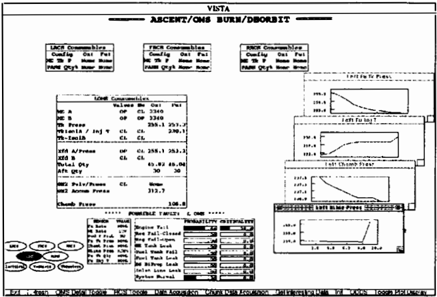
Before Vista, the traditional computer displays for the Propulsion Section resembled other cluttered, information-rich displays at the Mission Control Cen ter. The primary propulsion-systems display, in use before the Vista system was introduced, is pictured in Figure 3. The screen includes information on the sta tus of two OMS engines, and the three banks of RCS engines. During missions, if ground controllers become concerned about the health of one of the propulsion systems or subsystems, auxiliary screens may be re quested which contain such data as trend information about engine consumables. The complex primary and auxiliary displays of information can become burden some in situations that demand quick decision making, especially for flight engineers in training.
4.2 DECISION MODELS FOR PROPULSION SYSTEMS
In the first phase of the Vista project, we developed probabilistic and decision-theoretic models for assist-
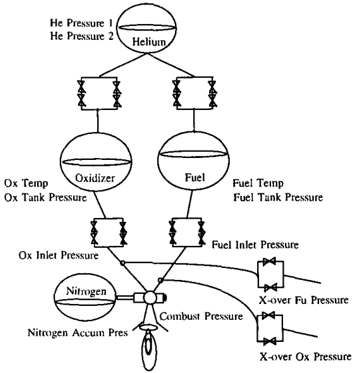
ing flight engineers with key subproblems in the Shut tle propulsion domain. First, we developed Bayesian networks for the Shuttle's propulsion systems. Figure 4 displays a basic schematic of the OMS engine. The overall operation of the propulsion engines is straight forward. A tank of helium gas maintains pressure on tanks of oxidizer and fuel. To fire an OMS engine, valves are opened which allow the fuel and oxidizer to mix and combust to provide thrust. In addition to the basic flows, ground controllers must also consider the status of a set of valves between various tanks, and crossover lines that allow propellant to be shared by different engine systems. Suites of temperature and pressure sensors are located at critical locations in the system. The telemetry about propulsion sys tems transmitted to ground stations consists largely of information from these sensors.
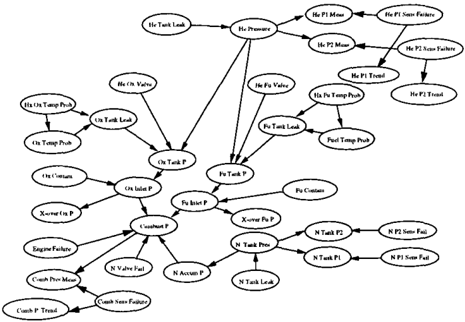
Figure 5 shows the graphical structure of a Bayesian network for an OMS engine. The Bayesian networks that we constructed for Shuttle propulsion systems are notable in that they include rich representations of sen sor failures and errors. The models consider failures of sensors as well as failures of core components of propulsion systems. The sensor-error models included in the Bayesian networks represent information about the validity of sensors as well as the way that different sensors fail. Experts with long-term experience make use of evidence about sensor failure, such as noting that a specific class of sensor is generating a sinusoidal output or is trending upward when a physical model only makes possible decreasing quantities of the mea sured substance.
4.3 REPRESENTING ACTION AND TIME
Moving from inference about anomalous states to the realm of actions, we modeled decisions and outcomes for different anomalies and contexts. We enumerated available actions and considered the time-dependence
of outcomes. We assessed time-dependent utility in terms of the dynamically changing probability that a mission would be terminated prematurely or, for more catastrophic situations, that the entire orbitor would be lost, as a function of the anomaly, the action taken, and the persistence of fault states. We found that it was useful to use multiattribute utility to understand the tradeoffs among dimensions of value in an out come, including such key attributes as the portion of the target velocity reached and the probability of dam aging an engine being used for the desired impulse.
The Vista-11 system went into service at the Mission Control Center in 1993, following laboratory validation with a prototype named Vista-I. Vista-II monitors and interprets live telemetry being transmitted from the Shuttle. When the probability of an anomaly (includ ing sensor faults) exceeds a small threshold, the system displays a list of possible faults ranked by likelihood with an associated graphical display of the probabili ties of the faults. In addition to providing a probability distribution over faults, the system also generates rec ommendations about ideal action. A list of possible actions, ranked by expected utility is displayed.
5 DISPLAY DECISION MAKING
Several approaches to the management of display and information access were implemented in the initial Vista systems [Horvitz et al., 1992]. These include means for flexibly controlling the detail of information presented about specific subsystems depending on the context and inference about anomalies, the use of a list of faults, sorted by probability, as an active index into related trend information, and the prioritization of faults by the expected cost of delay to review the faults.
To build a flexible approach to display, data templates-contiguous sets of related information were designed for each subsystem (the two OMS sys tems and the three RCS systems). A spectrum of tern-
plates were created for each subsystem, spanning a range of completeness from the most detailed to pro gressively less complete, more abstract presentations of data. We also introduced levels of detail in the dis play of diagnostic information, by allowing the system to display probabilities of anomalies at more abstract levels of the subsystems, such as the probability of a sensor failure versus a specific sensor failing.
In the main Vista display, templates for the different subsystems are configured in an invariant pattern, in troducing spatial stability in the location of informa tion about different subsystems. At run time, the re sults of inference are used to modify the amount of de tail displayed about each subsystem; the data template for a subsystem appears to telescope from a compact summary into a larger, more complete presentation. The overall positioning of the data templates for differ ent subsystems remains the same during the resizing of presentations on specific subsystems, minimizing the effort needed to locate information. Preferred levels of detail for each subsystem were predefined for different contexts (e.g., critical OMS burn, orbital coast, etc.). Beyond automated control, we designed the interface to allow users easy manual access to any information available to the Vista system.
The combination of decision-theoretic inference with flexible access to a range of detail on subsystems has worked well in Vista. Nevertheless, we have continued to pursue principles for controlling displays. We will now focus on newer methods, several of which are be ing validated for the forthcoming Vista-III system for the Mission Control Center.
5.1 EXPECTED VALUE OF REVEALED INFORMATION
The goal of display management in time-critical sit uations is to maximize the expected utility of an op- erator's decisions. We now explore methods to char acterize the costs and benefits of displaying different configurations of information.
Let us first consider a quantity we refer to as the expected value of revealed information (EVRI). EVRI is the expected value of considering additional quanti ties of information that is available with certainty, yet is hidden from a decision analysis. The expected util ity of considering previously hidden information must be evaluated in the context of a complete decision theoretic analysis, taking advantage of all of the avail able information. EVRI differs from the expected value of information (EVI) in that EVI includes a consideration of uncertainty about the state of obser vations. In the case of EVRI, an automated display manager has access to all available data. EVI is ap propriate metric for display in cases where a system must expend effort before access is gained to sensor values.
Consider the case of monitoring complex systems such as Shuttle propulsion systems. Human operators are charged with reviewing data that is typically accessed through a battery of sensors that innervate a mon itored system. We will consider use of a display management system to make decisions about the na ture and quantity of evidence E to be displayed. How ever, we could apply a similar analysis for controlling the display of information about other distinctions rep resented in or inferred from a decision model.
Assume that a monitoring system has access to a set of sensed observations, E. The probabilities over hypotheses of interest H (e.g., failures in a moni tored system), inferred with a gold-standard diagnos tic model that takes into consideration all available data, p (H I E , � ), can be used to compute the expected utility of the gold-standard action, AG*,
Let us now hide some evidence from the analysis and consider, with the same decision model, the value of revealing or displaying a subset of observations, E C E. We compute a potentially revised optimal action, AD*, based on the revised probability distri bution, p(HIE, � ). We compute the best action by substituting the revised probability distribution into Equation 1,
We must evaluate the expected utility of AD* with the gold-standard probability distribution, considering all of the available evidence E,
We can now define the expected value of revealed in formation. The EVRI(e, E, E) is the expected value of
revealing a set of additional information e in a context defined by the set of previously revealed information E and the set of all available evidence E. Note that the EVRI is zero if the action does not change with the revealed information.
EVRI does not take into account the costs potentially associated with the review of increasing quantities of information. Action may be delayed if a decision making agent must process additional information. Such time delays may change the best action or in cur significant losses in the maximum expected utility in time-critical settings. The net expected value of re vealing information ( NEVRI ) includes the costs and benefits of reviewing the additional information. Let us assume that costs are based solely in deterministic delays t ( e) required to review information e. The best decision given consideration of only evidence E is,
The expected value of this decision is,
conditioning the probability of states of the system on the complete set of available evidence. The NEVRI can be computed by considering the best actions AD· and expected utilities of these actions, given a consid eration of t ( E + e) versus t ( E).
Note that we can easily generalize NEVRI to include information about the uncertainty associated with the time required to review information.
Let us consider the situation where a subset of all in formation ( e.g., a subset of relevant telemetry from the Shuttle ) is revealed by an automated display man ager to a decision maker charged with responsibility for making a decision. For now, we assume that the deci sion maker is an expert who acts in accordance with a gold-standard diagnostic model but requires increasing amounts of time to review larger quantities of informa tion. We can use NEVRI to consider the costs versus benefits of displaying alternate subsets of available in formation. We can search through all configurations of evidence to find a subset of information, e*, that maximizes the expected utility,
For the general case, finding the best subset of moni tored information to display requires a search over all combinations of data. We will discuss practical strate gies that coincide with extensions to current Vista dis play policies in Section 7. First, we will generalize EVRI to the expected value of displayed information ( EVDI ) .
5.2 GENERALIZATION TO VALUE OF DISPLAYED INFORMATION
EVRI considers the costs and benefits of revealing sub sets of all available observations in the context of a gold-standard model. In the general case, we cannot assume that a user will act in accordance with a gold standard diagnostic or decision model. A novice deci sion maker may make suboptimal decisions relative to a gold-standard decision-theoretic model yet still be re lied upon for action given traditional desires for having a human in the loop. Alternately, we may wish to use automated display management to train a user about the most important information to consider. We now generalize the EVRI to the expected value of displayed information ( EVDI ) by considering an operator's ac tions in response to varying quantities of displayed in formation and the value of this information to the user from the perspective of the gold-standard model.
We wish to automate decisions about display to opti mize the expected value of an operator's actions. AI-
though we can consider several different forms of infor mation, including the output of automated inference, we shall again cast the discussion in terms of decisions about the display of subsets of all monitored observa tions, E � E. To make a decision about the nature and quantity of evidence to reveal to the system user, we consider the likelihood of alternative user actions and likelihoods of delay as functions of displayed data.
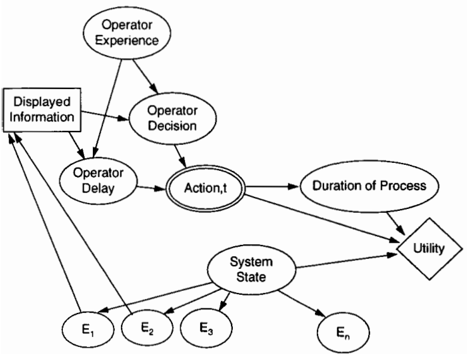
Within the context of the time-critical decision prob fems broadly captured by the influence diagram in Fig ure 2, the problem of displaying information in time critical settings is represented by the influence diagram displayed in Figure 7. We transform the human oper ator's decision and delay to chance variables that are influenced by the information displayed. We represent the user's expertise or background by conditioning the action and delay nodes on a variable representing ex pertise. If we have certain knowledge about the user's background, we condition the decision node on this information, represented by an information arc.
To simplify our equations, we will assume that the de lay in the human operator's action is a deterministic function of the quantity of evidence displayed and is independent of the ultimate action taken. We will keep the operator's expertise implicit. Given an initial dis play of system observations E, and a complete set of evidence E known to a display manager, the net value of displaying additional information ( EVDI) e is,
We can generalize EVDI to include a consideration of other factors including uncertainty about relevant information that a user may already know or has ac quired from other sources. The probability distribu tion over delay may depend on such factors as the op erator's uncertainty about the best decision to make and the perceived criticality of a situation. We can ex tend the EVDI measure by considering uncertainty in delays, and by conditioning the probability distribu tion over length of delay on the quantity of evidence, and on such information as an operator's predicted uncertainty about the best action [ Horvitz, 1995].
6 MODELING USER ACTIONS
In time-critical contexts, the goal of a display man ager is to assist a user with taking the best action as soon as possible. As indicated by Equation 9, a key task in implementing approaches to display manage ment based on EVDI is the development of a proba bilistic model of an operator's beliefs and actions, as a
function of displayed information. Assume that a gold standard model indeed represents the preferences and probabilistic relationships of the best expertise avail able, but that the limited availability of experts and policies of an institution lead to situations that require nonexperts to make decisions. We wish to develop a display manager that continues to reason about how alternative quantities of information will change the nature and timeliness of such decisions.
6.1 BAYESIAN MODELS OF USER BELIEFS
To control or design a display based on EVDI, we need to gain access to knowledge about p(A; IE,�) and t (E) ( or, more generally, p(tk\E,A,�)). For simplification, let us assume that we have access to deterministic in formation about the amount of time required to review information as a function of the quantity of informa tion displayed. We will focus on inference about user actions. We explored two approaches to modeling ac tions of operators as a function of their training and the data displayed.
One approach to modeling an operator's actions is to work with experts with experience with training peo ple in their area of expertise, to construct directly models of user action. These models output prob ability distributions over user actions given assumed sets of observations displayed to an operator. Build ing probabilistic models that make inferences about p(A\E, �) action is difficult; the modeling and assess ment of actions typically requires the analysis of a large number of situations. It can be more efficient to con struct Bayesian user models that represent, from an expert trainer's perspective, the causal probabilistic relationships assumed by trainees at varying levels of experience. These could be used to model the beliefs of users about anomalies given displayed data.
As part of the Vista effort to build models of user action for EVDI-based display, experts were asked to build Bayesian networks that could be used to make
inferences about the beliefs of users in response to ob servations. We assessed from expert trainer's models of the causal knowledge and uncertain dependencies that represent expertise at different levels of training. The goal of this work was to compute the probabili ties that a user would assign to the presence of system faults, after reviewing sets of observations. We found that e � �er � trainers were comfortable building such probab1hsttc models representing users' beliefs about a monitored system. The models of user belief for Shuttle pro p ulsi . on systems were tested and validating as pe � formmg hke users at some level of training or expenence.
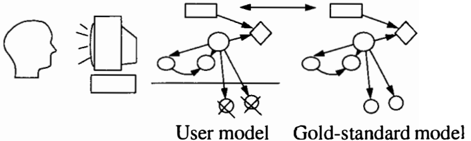
As highlighted by Figure 9, experts found particularly useful a strategy of beginning the task of modeling a none � p � rt 's view of diagnosis and decision making by � xammmg � h � gol . d-standard decision model and prun mg away d1stmctwns and dependencies considered to be absent in trainees' models of a monitored system. We use p( H D IE,�) to refer to the predictions of these Bayesian user models about the beliefs of a user given displayed information E.
6.2 FROM BELIEFS TO ACTIONS
Assume that we have a model that experts certify as providing accurate inference about an operator's beliefs as a function of evidence. How can we use p( H D IE,�) to compute the probability distribution over actions by the user, p(Ai\E,�)? If we had ac cess t � an operator's utility model, u D (Ai, Hi, t), rep resentmg � he user's perception of outcomes and delays, and plausible set of actions and their dependencies, we co ? � d choose the action that maximizes the expected utihty from the user's perspective and, thus, generate a "best" user action, A D ·. However, we cannot as sume that users combine their beliefs in a coherent decision-theoretic manner. '
Seve � al approaches show promise for allowing us to ap proximate p( A; IE,�). We assessed from experts user model preferences to explore methods for combining user beliefs about faults into user actions. Experts identified differences between the preference model of a seasoned operator and a less-experienced person.
Given these models, we have explored several methods for mapping the inferred user's beliefs into the likeli hood of actions, p(A;IE, e) for display management. In one approach, we assume that operators will at tempt to maximize expected utility. In another, we assume more conservatively, that the likelihood of ac tions is a monotonically increasing function of the in ferred expected utility of the actions given the user's preference model. Studies of the behavior of users with different levels of training will be useful for confirming and tuning such user models .
7 FLEXIBLE DISPLAY OPTIONS
EVRI and EVDI can be employed in a variety of ways to enhance the information displayed for time-critical monitoring. EVRI is more appropriate for use in situa t � ons where expert engineers will be making decisions, giVen the EVRI assumption of gold-standard decision making. We have found EVRI to be more appropri ate for real-time monitoring of Shuttle propulsion sys tems because real-time decision making is limited to e :< perts. EVDI promises to be useful for building effec tive systems for training and education. Applications of EVDI require greater amounts of engineering effort than EVRI because of the modeling of user's beliefs and actions required for EVDI.
The most general use of the display metrics involves a search through all combinations of information avail able for display. Rather than consider a search over all subsets of evidence, we can use the metrics at run time or design time to make coarser display decisions and employ approximate analyses based on single-ste � analysis or on a limited lookahead.
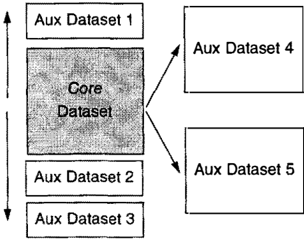
T � e met � ic � ca � be used . as tools for evaluating and re fi � mg ex1stmg mformatwn layouts and display strate gws. For example, we can examine the value of modi fications to predefined clusters of related information with � n eye . to <:' ptimizing a static display, or for doin � real-time tallormg of the templates depending on con text. We can also use the metrics to make decisions about the display of auxiliary clusters of information. Computer-based monitoring systems often display a default, core set of data, yet may have access to a large quantity of supportive information that is not t � pically rel . evant to decisions. System operators may Wish to rev1ew a stable pattern of key variables, yet have access to supportive auxiliary information when it � ight change their decision. As an example, the mam screen for Shuttle propulsion systems has not traditionally included information about sensor trend information, yet distinctions about trends are repre sente ? in the diagnostic models and can provide valu able mformation the likelihood of sensor failures. De-;. c � sions a�out auxiliary i � formation have become espe cially sahent when momtoring systems are upgraded
from character-based displays to graphic workstations making available more display real-estate.
The EVRI and EVDI metrics can be used to deter mine when it is valuable to display auxiliary or more detailed sets of data, by considering the value versus the costs of displaying auxiliary information. For rea soning about the value of displaying auxiliary clusters of information, we continue to monitor telemetry and perform decision-theoretic inference. As highlighted in Figure 5, we compare the expected value of decisions with the core information display, Ecore, versus with different extensions, Ecore + Efux. If the additional in formation leads to decisions with higher expected util ity than the decision indicated by the information in the core display, the auxiliary in f ormation is displayed.
The display-management metrics can provide a formal foundation for such user-interface functionalities as the telescoping of templates of information about subsys tems that was introduced in Vista-1. If we are mon itoring several subsystems, as in the case of Shuttle propulsion systems, we can generate, for each subsys tem, a set of templates of progressively greater detail and size. EVRI or EVDI can be used to make decisions about the escalation of templates, from a summary or core set of data to larger, more detailed expansions.
We do not have to model explicitly the costs of re viewing information to derive value from the metrics. For example, we can use EVRI or EVRI to search for minimal sets of evidence that are consistent with the action that has the greatest expected utility from the perspective of the gold-standard model. The minimal information strategy can be combined with means that allow user's to request with ease additional variables of interest. As another approach, we can employ EVRI to display auxiliary information whenever the additional information can change the best action taken, regard less of the criticality, or taking into consideration only gross indications of criticality.
In another application of the metrics, rather than us ing EVRI or EVDI to edit the displayed data, we seek to make more conservative decisions about the high lighting of information as a function of the situation and user. We again employ a myopic or limited looka head search through all data being displayed, or eval uate classes of information as clusters. For the my opic analyses, we compute the value of revealing single pieces of data considered as hidden from the decision maker, in the context of the rest of the displayed data. Data can be highlighted with a range of intensity or color in accordance with the increasing value of data as indicated by the EVRI or EVDI. We can choose to highlight only the top n observations, a number that may be determined dynamically by the quantity of data and time criticality. A similar analysis can be used to analyze the overall importance of different classes of clustered data to control the highlighting of different classes of data.
We implemented in a prototype of the forthcoming Vista-III system the use of EVRI to highlight critical information with color to prioritize the review of data. We are currently exploring the use of EVRI for auto mated display of auxiliary information and for control ling the telescoping of information templates. We will be validating the new functionalities and expect the Vista-III system to be certified for flight at the Mission Control Center in the coming year. Overall, experts and trainees have been enthusiastic about the display management and decision-theoretic recommendations provided in the evolving Vista system.
We are working to further extend the display management methods. In particular, we are ex ploring more sophisticated display-management tech niques that take into consideration incompleteness or inaccuracy in the models of diagnosis and decision making used to compute advice. We wish to endow a reasoning system with explicit methods for evaluating the confidence in its diagnostic conclusions. Such self awareness about model incompleteness, coupled with knowledge of when a human decision maker is likely to have deeper insights than the computer-based rea soner, will be valuable in building genuine decision making associates.
We are concerned with the modeling effort that can be required to build systems based on EVDI. We are in terested in developing more efficient methods for build ing and learning models that describe with fidelity the beliefs and actions of users in response to displayed in formation. We are excited about recent innovations in learning Bayesian networks from data and for combin ing expert models with data for building these models [ Beckerman et al., 1994 ] .
We look to future research in cognitive psychology for information about the costs associated with the re view of information, including studies of how increased amounts of information and clutter can be expected to lead to delays, confusion, and, ultimately, to subopti mal decisions. Psychological studies can also give us insights about the value of such user-interface actions as highlighting displayed data with color, and costs associated with the instability of dynamically chang ing interface configurations. We are also interested in gaining deeper insights about the perceptions of users about automated display decisions versus completely manual access of auxiliary information. Such informa tion about preferences and performance can allow us to build more sophisticated, effective display managers.
Beyond display management applications, EVRI and EVDI can be harnessed to make automated decisions about the most valuable information to transmit to re mote decision makers. In such applications, we balance the value of information to enhance the timeliness or quality of decisions with the costs of transmitting the data. The methods provide a utility-based foundation for controlling the incremental transmission of time-
critical information over limited"bandwidth channels.
We hope that the metrics and methods we described will be useful to others tackling issues surrounding real-time monitoring and control, and offline design of informational displays. We believe that the combi nation of automated decision-support and automated display systems will allow people to keep pace with the growing complexity and stakes associated with under standing and controlling the machines and software that we rely on to accomplish critical tasks.
Acknowledgments
We appreciate the long-term contributions on the Vista Project by Jim Martin, Corinne Roukangas, Kevin Scott, Sampath Srinivas, and Cynthia Wells. We thank Jack Breese, Robert Fung, David Hecker man, Kathy Laskey, Paul Lehner, and Michael Shwe for useful feedback on Vista research. We are grateful to colleagues at the participating sites, including the NASA Johnson Space Center, Rockwell Palo Alto Lab oratory, NASA Ames Research Center, and Stanford University. This work was supported by the NASA Johnson Space Center, Rockwell Science Center, the Rockwell Space Operations Company, and National Science Foundation Grant IRI-9108385.
References
[Breese et aL, 1991] Breese, J., Srinivas, S., and Fiske, R. (1991). A utility-based pilot vehicle interface. In Proceedings of DARPA Symposium on Associate Technology, pages 259-266, George Mason Univer sity, Fairfax, V A.
[Bruner et al., 1956] Bruner, J., Goodnow, J., and Austin, G. (1956). A study of thinking. Wiley and Sons.
(Doyle et al., 1989] Doyle, R., Sellers, S., and Atkin son, D. (1989). A focused, context-sensitive ap proach to monitoring. In Proceedings of the Eleventh International Joint Conference on Artificial Intelli gence, Detroit, MI, pages 1231-1237. International Joint Conference on Artificial Intelligence.
[Beckerman et al., 1994] Beckerman, D., Geiger, D., and Chickering, D. (1994). Learning Bayesian net works: The combination of knowledge and statis tical data. In Proceedings of Tenth Conference on Uncertainty in Artificial Intelligence, Seattle, WA, pages 293-301. Morgan Kaufmann.
[Horvitz, 1987a] Horvitz, E. (1987a). A multiattribute utility approach to inference understandability and explanation. Technical Report KSL-28-87, Medical Computer Science Group, Section on Medical Infor matics, Stanford University, Stanford, CA.
[Horvitz, 1987b] Horvitz, E. (1987b). Reasoning about beliefs and actions under computational re- source constraints. In Proceedings of Third Work shop on Uncertainty in Artificial Intelligence, pages 429-444, Seattle, Washington. American Associa tion for Artificial Intelligence. Also in L. Kanal, T. Levitt, and J. Lemmer, ed., Uncertainty in Artificial Intelligence 3, Elsevier, 1989, pps. 301-324.
[Horvitz, 1988] Horvitz, E. (1988). Reasoning under varying and uncertain resource constraints. In Pro ceedings AAAI-88 Seventh National Conference on Artificial Intelligence, Minneapolis, MN, pages 111116. Morgan Kaufmann, San Mateo, CA.
[Horvitz, 1990) Horvitz, E. (1990). Computation and Action Under Bounded Resources. PhD thesis, Stan ford University.
[Horvitz, 1995] Horvitz, E. (1995). Transmission and display of information: A decision-making perspec tive. Technical Report Microsoft Technical Report MSR-TR-95-13, Microsoft Research, Microsoft.
[Horvitz et al., 1989] Horvitz, E., Beckerman, D., Ng, K., and Nathwani, B. (1989). Heuristic abstrac tion in the decision-theoretic Pathfinder system. In Proceedings of the Thirteenth Symposium on Com puter Applications in Medical Care, Washington, DC, pages 178-182. IEEE Computer Society Press, Los Angeles, CA.
(Horvitz et al., 1992] Horvitz, E., Ruokangas, C., Srinivas, S., and Barry, M. (1992). A decision theoretic approach to the display of information for time-critical decisions: The Vista project. In Pro ceedings of the Conference on Space Operations and Automation and Research, January, 1992, NASA Johnson Space Center. National Aeronautics and Space Administration.
[Horvitz and Rutledge, 1991] Horvitz, E. and Rut ledge, G. (1991). Time-dependent utility and action under uncertainty. In Proceedings of Seventh Con ference on Uncertainty in Artificial Intelligence, Los Angeles, CA, pages 151-158. Morgan Kaufman, San Mateo, CA.
- [Mclaughlin, 1987] Mclaughlin, J. (1987). The utility directed presentation of graphical simulation. Tech nical Report TR-87-59, Stanford University.
- [Miller, 1956] Miller, G. (1956). The magical number seven plus or minus two; some limits on our capacity for processing information. Psychological Review, 63:81-97.
- (Morrin et al., 1961] Morrin, R., Forin, B., and Archer, W. (1961). Information processing behav ior, the role of irrelevant stimulus information. Jour nal of Experimental Psychology, 61:89-96.
- [Simon, 1972] Simon, H. (1972). The theory of prob lem solving. Information Processing, 71:261-277.
[Waugh and Norman, 1965] Waugh, N. and Norman, D. (1965). Primary memory. Psychological Review, 72:89-104.