Contents
2512.12980v1
Reveal Hidden Pitfalls and Navigate Next Generation of Vector Similarity Search from Task-Centric Views
Tingyang Chen Zhejiang University Hangzhou, China [email protected]
Haotian Wu
Zhejiang University
Hangzhou, China [email protected]
Yunjun Gao
Zhejiang University
Hangzhou, China [email protected]
Cong Fu
Shopee Pte. Ltd. Singapore, Singapore [email protected]
Hua Fan
Alibaba Cloud Computing Hangzhou, China [email protected]
Yabo Ni
Nanyang Technological University Singapore, Singapore [email protected]
Jiahua Wu Shopee Pte. Ltd. Singapore, Singapore [email protected]
Xiangyu Ke ∗
Zhejiang University Hangzhou, China [email protected]
Anxiang Zeng
Nanyang Technological University
Singapore, Singapore [email protected]
Abstract
Vector Similarity Search ( VSS ) in high-dimensional spaces is rapidly emerging as core functionality in next-generation database systems for numerous data-intensive services - from embedding lookups in large language models ( LLMs ), to semantic information retrieval and recommendation engines. Current benchmarks, however, evaluate VSS primarily on the recall-latency trade-off against a ground truth defined solely by distance metrics, neglecting how retrieval quality ultimately impacts downstream tasks. This disconnect can mislead both academic research and industrial practice.
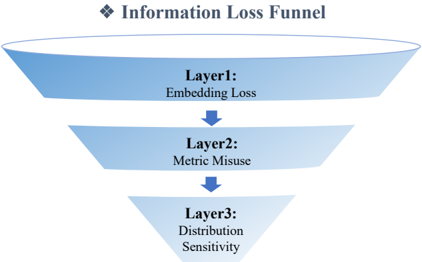
We present Iceberg , a holistic benchmark suite for end-to-end evaluation of VSS methods in realistic application contexts. From a task-centric view, Iceberg uncovers the Information Loss Funnel , which identifies three principal sources of end-to-end performance degradation: (1) Embedding Loss during feature extraction; (2) Metric Misuse , where distances poorly reflect task relevance; (3) Data Distribution Sensitivity , highlighting index robustness across skews and modalities. For a more comprehensive assessment, Iceberg spans eight diverse datasets across key domains such as image classification, face recognition, text retrieval, and recommendation systems. Each dataset, ranging from 1M to 100M vectors, includes rich, task-specific labels and evaluation metrics, enabling assessment of retrieval algorithms within the full application pipeline rather than in isolation. Iceberg benchmarks 13 state-of-the-art VSS methods and re-ranks them based on application-level metrics, revealing substantial deviations from traditional rankings derived purely from recall-latency evaluations. Building on these insights, we define a set of task-centric meta-features and derive an interpretable decision tree to guide practitioners in selecting and tuning VSS methods for their specific workloads. Finally, we outline promising avenues for future research aimed at closing the gap between synthetic VSS benchmarks and production deployments.
ACMReference Format:
Tingyang Chen, Cong Fu, Jiahua Wu, Haotian Wu, Hua Fan, Xiangyu Ke, Yunjun Gao, Yabo Ni, and Anxiang Zeng. 2026. Reveal Hidden Pitfalls and
∗ Corresponding author.
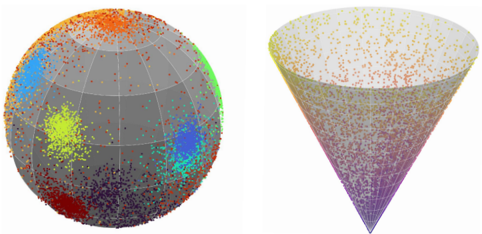
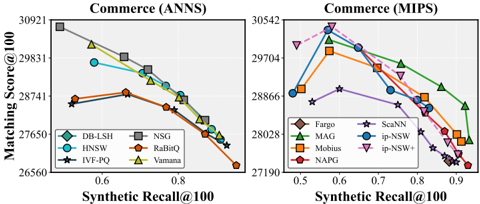
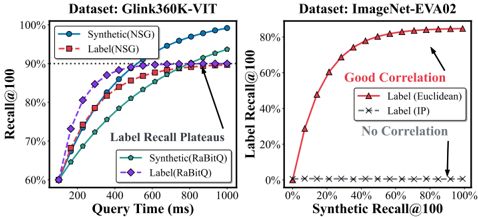
Figure 1: Illustration of the gap between synthetic recall and task-related performance. Left: face recognition dataset; right: image classification dataset. See §3 for dataset details.
Navigate Next Generation of Vector Similarity Search from Task-Centric Views. In Proceedings of ACM International Conference on Management of Data (SIGMOD'26). ACM, New York, NY, USA, 15 pages. https://doi.org/ XXXXXXX.XXXXXXX
1 Introduction
Vector Similarity Search ( VSS ) in high-dimensional spaces serves as a core primitive in modern databases [56] for various applications like recommendation systems [32] and retrieval-augmented generation ( RAG ) pipelines [42]. As adoption widens, practitioners must choose VSS methods that satisfy both throughput and task-level effectiveness . Existing benchmarks [11, 38, 44] primarily measure the recall-speed trade-off against ground truths derived solely from distance metrics (e.g., Euclidean or Inner-Product). These synthetic metrics abstract away from task semantics, ignoring applicationspecific labels or utility, and thereby obscure how retrieval quality propagates to downstream outcomes, leading to a disconnect between academic evaluations and practical deployment criteria. In our preliminary analysis from a task-centric view, we identify a long-overlooked pitfall in VSS , termed the Information Loss Funnel , which helps explain why high-synthetic recall retrieval does not necessarily guarantee strong end-task performance, as illustrated below:
Example 1. Figure 1 contrasts a widely used synthetic metric (synthetic recall@100) with a downstream-aware measure (label recall), on two public datasets. Synthetic Recall@100 evaluates how close the retrieved vectors to a query in terms of distance (e.g., Euclidean or Inner Product), whereas label recall measures the fraction of those 100 retrieved items whose class or identity label matches the query.
On Glint360K-ViT for face recognition (left), NSG [27] attains 99% synthetic recall@100 faster than RaBitQ [31], yet achieves only 90% label recall - and does so more slowly than RaBitQ . This divergence reveals that superior synthetic recall need not translate to better task effectiveness. The ImageNet classification case (right) is even more dramatic: with Euclidean distance, synthetic recall@100 and label recall track closely, but under inner-product distance, synthetic recall@100 soars to 99.9% while label recall collapses below 1%. In other words, the index returns almost exclusively wrong-class images despite an ostensibly ideal benchmark score, demonstrating that conventional recall-latency evaluations can be entirely misleading for real-world tasks with a mismatched metric.
These findings demonstrate that optimizing synthetic recall metrics alone neither ensures improved task-level performance nor reveals the most appropriate similarity measure. We trace the mismatch to a three-stage Information Loss Funnel : Layer 1. Embedding Loss : Mapping raw data to fixed-length vectors inevitably discards fine-grained information. Hence, vector proximity does not always align with task-specific utility. Layer 2. Metric Misuse : Applying a generic distance measure that poorly matches the geometry of the learned embeddings can amplify errors, especially when the embedding model is trained with complex objectives [26, 35] beyond pure metric learning [34, 41]. Layer 3: Distribution Sensitivity : VSS methods differ in how they balance recall vs. latency under varying data distributions. Choosing an index that lacks robustness to the specific vector distribution in use can incur significant degradation in both throughput and end-task accuracy.
However, most public benchmarks probe only the third layer, leaving the funnel's upper stages untested. To remedy this oversight, we introduce Iceberg , a holistic, task-centric benchmark suite that exposes the hidden pitfalls of VSS evaluation and guides future algorithmic development. Iceberg makes a continuous and tightly integrated set of contributions. It first introduces the informationloss funnel, which exposes critical yet overlooked issues in the existing literature. It then provides a suite of benchmarks with newly labeled datasets that empirically validate this model. Building on these analyses, it further proposes a selection method that operationalizes the framework's insights, enabling end users to make task-aligned algorithmic choices. Finally, it highlights promising directions for bridging the gap between academic research and industrial practice. The main contributions of Iceberg are summarized as follows and visualized in Figure 2:
(1) Information Loss Funnel: A Fine-Grained Diagnostic Model.
Weintroduce the Information Loss Funnel, a three-layer framework that systematically diagnoses why vector similarity search methods fail to deliver on task-level objectives. By in-depth examining (1) Embedding Loss, (2) Metric Misuse, and (3) Distribution Sensitivity, our model unifies disparate research threads under a common taxonomy. This layered perspective not only reveals hidden failure modes masked by synthetic benchmarks but also guides researchers toward the most impactful optimization targets.
(2) Comprehensive Task-centric Evaluation Benchmark. To assess and validate the diagnostic model, we release a broad benchmark suite spanning eight diverse datasets from four representative end-application domains - image classification, face recognition, text retrieval, and large-scale recommendation - each with
| Benchmark Name | Scale | Embedding Model | Funnel Scope | Domain | Downstream Utility | Explainability |
|---|---|---|---|---|---|---|
| ANN-Benchmark [11] | Small | Out-dated Modest New | Partial | ANNS | ✗ | ✗ |
| Big-ANN-Benchmarks [64] | Large | Partial | ANNS | ✗ | ✗ | |
| BigVectorBench [38] | Large | Partial | ANNS | ✗ | ✗ | |
| MTEB [54] | Small | New | Partial | ANNS | ✗ | ✗ |
| IceBerg (this work) | Large | New | Full | ANNS & MIPS | ✓ | ✓ |
1M-100M vectors generated from state-of-the-art embedding models [2, 5, 8, 9] and paired with task-specific ground truths. We evaluate 13 leading VSS methods (covering tree-, hashing-, clustering-, and graph-based) on both Approximate Nearest Neighbor Search ( ANNS ) [10, 21, 27, 31, 39, 51, 59] and Maximum Inner Product Search ( MIPS ) [17, 18, 33, 50, 53, 71]. Iceberg reports not only synthetic recall and throughput but also downstream utility measured by label recall@K, hit@K, and matching score@K (detailed in §3). Our results reveal substantial re-rankings compared to the traditional distance-only leaderboards, offering a more faithful guide for real-world deployments. Moreover, we develop an extensible pipeline that facilitates the integration of future tasks.
(3) Explainable Decision Tree for Method Selection. Leveraging the Information Loss Funnel model and extensive experimental analyses on benchmark datasets, we develop a lightweight, transparent decision-tree toolkit that maps dataset characteristics to suitable VSS methods. We identify easy-to-compute meta-features - such as clustering tightness , vector norm distributions , angular separations , and distance contrast - that correlate strongly with end-task performance. They form the decision nodes of our tree, enabling practitioners to rapidly extract them from any dataset and traverse the tree to determine the optimal VSS indexing and search strategy. To the best of our knowledge, this is the first public toolkit linking data traits directly to VSS method choices in a task-centric manner.
(4) Insights of Future Direction. Analysis of the Information Loss Funnel highlights three promising paths to bridge the gap between benchmarks and applications: (1) Task-Aware VSS : Jointly optimizes indexing and searching strategies with downstream objectives in mind; (2) Metric-Aware VSS : Automatically select, combine, or desensitize similarity metrics to accommodate embedding learned under complex, non-metric losses; and (3) DistributionAware VSS : Dynamically adapt the index structures and retrieval strategies to heterogeneous data distribution, e.g., skewed densities or segmented user behavior, to sustain both accuracy and efficiency.
Roadmap. §2 reviews previous related works and background. §3 provides a detailed description of the datasets, end tasks, methods, and overviews the design philosophy behind Iceberg . §4 raises the research questions, then provides a comprehensive analysis based on the experimental outcomes of Iceberg , and outlines the future directions. §5 discusses the implications and limitations of Iceberg . §6 concludes this paper.
2 Background
2.1 The Background of Vector Similarity Search
Vector similarity search encompasses two core problems, Approximate Nearest Neighbor Search ( ANNS ) in Euclidean space and Maximum Inner Product Search ( MIPS ) in inner-product space, and has spawned a rich ecosystem of methodic approaches. These methods fall into four principal categories based on their approaches and methodologies to data processing: (1) Tree-based methods [39, 50, 59, 60] recursively partition the vector space into hierarchical cells, offering fast query pruning but suffering as dimensionality increases; (2) Hash-based methods [21, 36, 47, 63, 66, 69, 71] map similar vectors into the same hash buckets, enabling sublinear search at the cost of controlled collision errors; (3) Clustering methods [10, 13, 25, 30, 31, 33, 52] compress the dataset into representative centroids or quantized codes, reducing both storage and computation but introducing quantization error; and (4) Graphbased methods [15, 17, 18, 27, 49, 51, 53, 58, 72], which construct complicated proximity graphs that capture neighborhood relationships well in high-dimensional space, thus turning search into a fast graph traversal with strong recall-latency trade-offs. For a comprehensive review, we direct the readers to recent tutorials and surveys [12, 52, 56, 67]. In traditional benchmarks, synthetic recall is commonly employed to evaluate the accuracy of VSS . It is commonly defined as the intersection between the retrieved top-k vectors and the ground-truth top-k neighbors.
2.2 The Current Popular Benchmarks
As vector similarity search ( VSS ) matures, standardized benchmarks are essential to assess vector quality, algorithmic advances and guide practical adoption in real-world deployment. Prominent suites such as ANN -Benchmarks[11], BigANN -Benchmarks[64], BigVectorBench [38], and MTEB [54] have made valuable contributions, but they mainly emphasize synthetic recall under fixed metrics and offer limited attention for end-to-end evaluation. We provide a structured comparison in Table 1, along six key dimensions: dataset scale, embedding model, funnel coverage, metric domain, downstream utility, and explainability.
First, in terms of dataset scale and embedding quality, ANN -Benchmarks is constrained to relatively small, legacy datasets (e.g., SIFT1M , GLOVE1M ) derived from outdated embedding models (e.g., Eigen decomposition, GoogLeNet ). As a result, these datasets fail to capture the complexity and semantic richness of modern applications. Big-ANN-Benchmarks and BigVectorBench represent progress by adopting larger-scale datasets and incorporating more recent embedding techniques. MTEB incorporates more advanced embedding models-including LLM -based ones-and focuses on evaluating the representation quality of different embeddings. However, its dataset scale is relatively small. Second, regarding evaluation scope-specifically funnel coverage and metric domain, all four benchmarks focus almost exclusively on ANNS and assess only limited portions of the information-loss funnel. MTEB is limited to Layer 1 (Embedding Loss), contrasting vectors from different representation models on a common task. It normalizes by default and disregards similarity-metric selection and distribution-dependent retrieval variance. The remaining benchmarks probe only Layer 3 (Distribution Sensitivity), neglecting the impacts derived from other layers. Moreover, they offer no evaluation for MIPS , despite its prevalence in recommendation and ranking systems. Third, existing benchmarks provide minimal or no support for task-level utility analysis (e.g., classification accuracy, recommendation hit-rate) and lack tools to explain why one method outperforms another in a given downstream context. Consequently, these benchmarks center on synthetic recall under a chosen metric. While this contributes to evaluation in some respects, users gain little actionable guidance for selecting methods aligned with their application objectives.
Iceberg addresses these deficiencies by spanning both ANNS and MIPS , employing large-scale, modern embeddings, and integrating end-to-end task utility assessment. Crucially, it delivers full-funnel coverage - including embedding fidelity and metric alignment probes - and an explainable decision tree that maps dataset meta-features to recommended methods. This holistic approach empowers practitioners to diagnose failure modes, interpret performance trade-offs, and make informed choices tailored to their specific workloads.
2.3 Mainstream Task-Centric Metrics for VSS
Vector similarity Search ( VSS ) underlines many real-world systems. In this work, Iceberg examines VSS in four important application domains: image classification , face recognition , text retrieval , and recommendation systems .
In these practical applications, industrial practitioners are not only concerned with the trade-off between synthetic recall and query throughput (QPS), but also prioritize realistic downstream task-centric metrics that reflect the true utility of the VSS system. Different applications have different goals for downstream tasks from vector similarity search. For image classification, the main concern is whether the returned images reflect the true query class, which is in favor of large scale image labeling and recognition. In face recognition, an important downstream task is to recall identity vectors corresponding to the query, prioritizing accuracy for security and payment. In text retrieval, operations involve determining whether a query can recall semantically relevant passages, measuring content matching accuracy. Recommendation system metrics
assess if item embeddings reflect users' preference for items and if they emphasize high-relevance, popular items like bestsellers, for the purpose of conversion and personalization. Despite the ubiquity of synthetic benchmarks (e.g., synthetic recall@K), these metrics can diverge sharply from task objectives - a mismatch we attribute to the Information Loss Funnel. By evaluating VSS methods against both synthetic and realistic task-centric metrics across diverse applications, Iceberg reveals where and why high synthetic recall may fail to deliver real-world effectiveness.
3 Resource Collection for Funnel Analysis
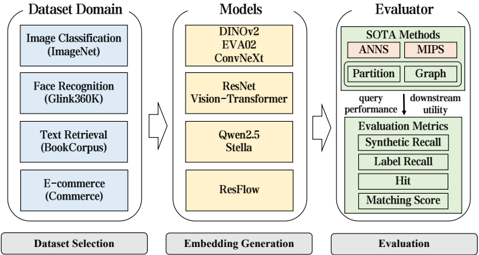
To operationalize the information loss funnel, Iceberg spans four representative, real-world tasks-image classification, face recognition, text retrieval, and recommendation. In § 3.1, we describe our data processing pipeline, including dataset selection criteria, task abstraction, and embedding generation for each application. § 3.2 presents the method evaluation setup, detailing the 13 state-of-the-art VSS methods, their configurations, theoretical properties, and performance metrics. In § 3.3, we outline our reproducibility framework to enable longitudinal studies of the information loss funnel. Figure 3 illustrates the end-to-end Iceberg workflow, and Table 2 summarizes the domains, dataset scales, embedding models, and downstream metrics.
3.1 Datasets for Important Application
(1) Image Classification. Image classification serves as a canonical use case for vector-based retrieval, aiming to align the knowledge representation of images with human conceptual understanding. The goal of VSS is to retrieve visually and semantically similar images for downstream tasks that align with human perception.
Data Collection. We use the ImageNet dataset [1] as the representative benchmark for image classification. This large-scale dataset contains 1,000 object categories, with 1,281,167 training images and 50,000 validation images, each annotated with ground-truth labels. Due to its broad coverage and widespread adoption in the computer vision community, ImageNet remains a standard resource for training and evaluating image classification models.
End Task Design. The image category annotations are treated as task-specific labels. An essential criterion for assessing whether the retrieved vectors satisfy the needs of the downstream task is the
| Task | Dataset | Data Num | Dim | Embedding Model | Task-specific Label | Task-centric Metrics |
|---|---|---|---|---|---|---|
| ImageNet-DINOv2 ImageNet-EVA02 | 1,281,167 1,281,167 | 768 1024 | DINOv2 [55] EVA02 [24] | Image Class Image Class | Label Recall@K Label Recall@k | |
| Image Classification | ImageNet-ConvNeXt ImageNet-AlexNet | 1,281,167 1,281,167 | 1536 4096 | ConvNeXt [70] AlexNet [40] | Image Class Image Class | Label Recall@K Label Recall@K |
| Face | Glint360K-ViT | 17,091,649 | 512 | ArcFace-IR101 [22] | Identity ID | Label Recall@K Label Recall@K |
| Recognition | Glint360K-IR101 | ArcFace-ViT [22] | Identity ID | |||
| Text | 17,091,649 | 512 | Stella_en_1.5B_v5 | Paragraph | Hit@K | |
| Retrieval | BookCorpus | 9,250,529 | 1024 | ID | ||
| Recommendation | 48 | ResFlow [26] | Item | Matching Score@K | ||
| Commerce | 99,085,171 | ID |
consistency between the labels of the retrieved images and that of the query. Thus, we define Label Recall@K as a task-centric metric.
Label Recall@K . It measures how many correct task-specific labels appear in the top-K retrieved results. It captures the fraction of retrieved vectors whose task-relevant labels match the query's label, providing a practical measure of downstream task performance.
where Q is the set of queries, 𝐿 ( 𝑥 ) is a label function to get label for vector 𝑥 , I(·) is an identity function returning 1 if input statement holds and 0 otherwise, and 𝑅 𝑖 means the 𝑖 th vector in the retrieved vector set 𝑅 with size 𝐾 .
Embedding Generation. Image embedding models are rapidly advancing with diverse representation strategies. To compare the impact of different models on the embedding space and downstream tasks, we evaluate representative state-of-the-art (leading methods in terms of classification accuracy under different research venues) backbone models: DINOv2 [5], EVA02 [6], ConvNeXt [4]. Furthermore, we used an old embedding model, AlexNet [40]. We did not include it in the major experiments, but rather used it to compare old and modern embeddings, illustrating how representation shifts affect downstream performance.
(2) Face Recognition. Face recognition is a specialized and highly important visual retrieval task, with widespread applications in areas such as security and payment. Unlike general visual classification, it demands extremely fine-grained accuracy to differentiate between individuals. The goal of VSS is to retrieve vectors corresponding to the same identity as the query face.
Data Collection. We adopt the open-source Glint360K dataset [7] as the representative benchmark for face recognition. This large-scale dataset contains over 17 million images spanning 360,232 identities, curated from public sources and annotated via a combination of manual and automated methods. For query construction in Iceberg , we randomly sample one face image per identity, with the first 20,000 identities used as the test set.
End Task Design. The identity ID corresponding to each face embedding is used as the task-specific label. Although the granularity of the tasks differs, face recognition and image classification share the same task-centric evaluation metric: Label Recall@K (refer to
Equation 1). This metric effectively captures the degree of identity match and serves as a reliable task-centric measure.
Embedding Generation. To emphasize the architectural diversity of the models, we selected representative backbones from both the CNN [3] and ViT [2] paradigms, and employed Arcface , a leading method specifically designed for face recognition, during training.
(3) Text Retrieval. Text retrieval is a critical problem in VSS , especially in the era of LLMs , where it plays a central role in RAG frameworks to mitigate hallucinations commonly observed in generative models. In text retrieval, the goal of VSS is to retrieve the text passages that best match a given query sentence, serving as an external knowledge source to provide relevant information.
Data Collection. We use a cleaned version of the open-source BookCorpus dataset, which contains text from approximately 19,000 books across diverse domains. The corpus was segmented into 9,250,529 paragraph-level chunks, each formed by concatenating eight sentences. From this collection, 10,000 paragraphs were randomly selected to extract the query set.
End Task Design. The unique ID of each paragraph was used as the label. The text dataset is composed of semantically independent passages, each paired with a query generated to reflect its topic. We use Hit@K as the task-centric metric.
Hit@K . This metric measures whether the most semantic relevant paragraph is included in the top-K retrieved results. Such a selfretrieval task is commonly used in downstream text applications, such as duplicate content detection.
where Q is queries set, 𝐿 ( 𝑥 ) is a label function to get label for vector 𝑥 , I(·) is an identity function returning 1 if input statement holds and 0 otherwise, 𝑅 ( q ) denotes the top𝐾 retrieved vectors for q .
Embedding Generation. Since the transformer-based, pretrain & finetune paradigm has dominated this text embedding training literature, we employed Stella [9] as our text embedding model. This model is tailored for complex text semantic representation and is distilled from a larger, high-performing architecture (i.e., Qwen2 [14]). It generates 1024-dimension vectors and exhibits strong representational capacity on standard text embedding benchmarks [54].
| Similarity Metric | Method | Category | Build Complexity | Search Complexity | Index Storage | Cross Metric |
|---|---|---|---|---|---|---|
| Inner Product | Fargo ScaNN ip-NSW ip-NSW+ Mobius NAPG MAG | Partition-based Partition-based Graph-based Graph-based Graph-based Graph-based Graph-based | 𝑂 ( 𝑛𝑑 ) 𝑂 ( 𝑘𝑛𝑑 ) 𝑂 ( 𝑛𝑑 log 𝑛 ) 𝑂 ( 𝑛𝑑 log 𝑛 ) 𝑂 ( 𝑛𝑑 log 𝑛 ) 𝑂 ( 𝑛𝑑 log 𝑛 ) 𝑂 ( 𝑛𝑑 log 𝑛 + 𝑑𝑛 1 . 16 ) | 𝑂 ( 𝛽𝑛𝑑 ) , 𝛽 ≪ 1 𝑂 ( 𝑐 1 𝑛 𝑘 𝑑 𝑞𝑢𝑎𝑛 ) 𝑂 ( 𝑑 log 𝑛 ) 𝑂 ( 𝑑 log 𝑛 ) 𝑂 ( 𝑑 log 𝑛 ) 𝑂 ( 𝑑 log 𝑛 ) 𝑂 ( 𝑑 log 𝑛 ) | Low. High. High. High. High. High. High. | ✗ ✗ ✗ ✗ ✗ ✗ ✓ |
| Euclidean Distance | RaBitQ IVFPQ DB-LSH HNSW NSG Vamana | Partition-based Partition-based Partition-based Graph-based Graph-based Graph-based | 𝑂 ( 2 ( 𝑛𝑑 2 + 𝑛𝑑 )) 𝑂 ( 𝑘𝑛𝑑 ) 𝑂 ( 𝑛𝑑 ) 𝑂 ( 𝑛𝑑 log 𝑛 ) 𝑂 ( 𝑛𝑑 log 𝑛 + 𝑑𝑛 1 . 16 ) 𝑂 ( 𝑑𝑛 1 . 16 ) | 𝑂 ( 𝑐 1 𝑑 log log 𝑑 ) 𝑂 ( 𝑐 1 𝑛 𝑘 𝑑 𝑞𝑢𝑎𝑛 ) 𝑂 ( 𝑛 𝑝 ∗ 𝑑 log 𝑛 ) , 𝑝 ∗ ≪ 1 𝑂 ( 𝑑 log 𝑛 ) 𝑂 ( 𝑑 log 𝑛 ) 𝑂 ( 𝑑𝑛 0 . 75 ) | High. High. Low. High. High. High. | ✗ ✗ ✗ ✗ ✗ ✗ |
𝑛 : number of data points; 𝑑 : dimension; 𝑘 : number of clusters; 𝑑 𝑞𝑢𝑎𝑛 : dimension of quantized vectors; 𝛽 and 𝑝 ∗ : LSH parameter from the origin papers.
(4) Recommendation Recommendation is a key application area for VSS . In this setting, VSS is used to retrieve items-such as products, content, or services-that are both semantically relevant to a user's preferences and aligned with broader popularity trends. A fundamental goal of retrieval in recommendation systems is to balance personal relevance with item popularity.
Data Collection. The Commerce dataset, derived from anonymized traffic logs of a major e-commerce platform, serves as a representative benchmark for large-scale E-commerce systems. Collected over several months, the dataset comprises 99,085,171 records of frequently purchased grocery items. In addition, a query set of 64,111 real user requests was constructed to summarize user profiles and associated intent keywords. Each query is annotated with a set of items with which the users show high preferences, enabling evaluation on downstream recommendation tasks.
End Task Design. We use the hit of user preferred Item IDs as labels for Commerce . In this task, VSS is required to retrieve vectors that are both relevant and popular. Thus, we use Matching Score@K as a task-centric metric.
Matching Score@K . It is used to evaluate downstream utility on the Commerce dataset. Because there are usually multi hits for each user, we use the cumulative score of those hits. This metric aligns with practical e-commerce objectives by promoting accurate and relevant product recommendations.
Where Q is the queries set, 𝐿 ( 𝑥 ) is a label function to get the label for vector 𝑥 , I(·) is an identity function returning 1 if the input statement holds and 0 otherwise, 𝑅 ( q ) denotes the top𝐾 retrieved vectors for q , H( q )) is the annotated items set related to query 𝑞 and 𝑃 () is the popular score related to the item.
Embedding Generation. We used ResFlow , a pre-trained personalized deep retrieval model [8], to generate 48-dimensional embeddings, a size chosen to balance performance and resource limitations in E-commerce platform. Unlike many high-dimensional datasets with low intrinsic dimensionality [20, 48], Commerce exhibits an intrinsic dimension nearly equal to its actual dimension, rendering a high information compression rate.
3.2 Methods Selection for Evaluation
We focus on two core directions in vector similarity search: Approximate Nearest Neighbor Search ( ANNS ) and Maximum Inner Product Search ( MIPS ), evaluating cutting-edge methods in each. Representative state-of-the-art methods were selected and categorized into partition-based and graph-based methods based on their retrieval mechanisms (Table 3).
Partition-based Methods. Partition-based methods divide the vector space based on similarity relationships, aiming to group similar vectors into the same partition to reduce the search space. These methods include tree-based, hash-based, and clustering-based approaches. We excluded tree-based methods from our evaluation due to their performance decline in high-dimensional spaces [11]. In Iceberg , we include 5 representative partition-based methods widely used in the fields of MIPS and NNS : Fargo [71], ScaNN [33], DB-LSH [66], RaBitQ [31], and IVFPQ [23].
Graph-based Methods. We refer to §2 for the detail information of graph-based methods. In Iceberg , we include 8 representative partition-based methods widely used in the fields of MIPS and NNS : HNSW [51], NSG [27], Vamana [37], Mobius [72], ip-NSW [53], ip-NSW+ [46], NAPG [65], MAG [17].
3.3 Reproducibility and Maintenance
Reproducibility. Reproducibility is a core principle of iceberg. This helps researchers understand and track the information loss funnel. We provide comprehensive resources and clear guidelines to ensure researchers can easily validate and reproduce our results:
Open-Source Codebase. All the code used for data generation, algorithm execution, and evaluation is available on anonymous GitHub: https://github.com/ZJU-DAILY/Iceberg . It includes scripts for setting up the environment, running experiments, and analyzing results. To promote transparency and reproducibility, we will host all datasets and embedding models used in this paper on Hugging Face. Users can either download the released datasets directly or reproduce them by applying the released embedding models to the raw data.
Clear Documentation. Our GitHub repository provides comprehensive documentation, including installation instructions, data schema, usage examples, and algorithm parameter settings.
Maintenance. Maintaining a robust and relevant benchmark for vector similarity search is an ongoing commitment. Our future plan focuses on two directions: (1) regularly updating with state-of-theart models, tasks, and retrieval methods to reflect evolving realworld applications, and (2) providing containerized environments for reproducible and hassle-free experimentation.
Guidance for extending to other tasks. At present, Iceberg primarily focuses on four tasks with large, well-curated public datasets. However, our framework is designed to support a wide range of VSS -based tasks, such as anomaly detection [45] and knowledge graph link prediction [62]. For new tasks, integration into the framework can be achieved by following the pipeline outlined below: (1) Select an embedding model to encode the raw dataset; (2) Define downstream evaluation metrics for the target task; (3) Apply the VSS method for indexing and retrieval; (4) Conduct evaluation and analysis. We provide additional examples in our GitHub repository.
4 Experimental Evaluation
In this section, we evaluate the end-to-end performance of vector similarity search across a variety of well-structured datasets from multiple domains. Our investigation explores the information loss funnel and the practical efficacy of these systems by addressing four pivotal research questions:
- RQ-1: How does information loss funnel impact task-centric metrics utility in vector similarity search applications?
- RQ-2: How to select the most suitable vector similarity search algorithm considering the information loss funnel?
- RQ-3: What is the realistic ranking of the methods in terms of synthetic metrics and task-centric metrics utility comparison?
- RQ-4: What insights can guide the performance optimization of vector similarity search across different scenarios?
4.1 Experiment Setup
Configuration. The server is equipped with 2 Intel Xeon E5-2650 v4 CPUs running at 2.20 GHz, each with 12 physical cores and hyper-threading enabled, totaling 48 hardware threads. It has 128
GB memory. The operating system is CentOS Linux 7 (Core). We used the official implementations of the evaluated methods, making only necessary modifications for fair testing. We used Faiss 1.10 and ScaNN 1.3.5 for Python calls to IVFPQ and ScaNN , respectively. The other methods were implemented in C++.
Synthetic Evaluation Metric . In Iceberg , we evaluate method performance using both task-centric metrics and synthetic metrics. The task-centric metrics for each task are defined in §3. For synthetic metrics, we adopt evaluation protocols commonly used in the VSS literature. Let 𝑅 ′ 𝑡 denote the set of 𝐾 vectors returned by the VSS method, and 𝑅 𝑡 represent the ground truth based on the similarity metric, the synthetic recall@K is formally defined as
synthetic recall is used to evaluate the recall of VSS under a given distance metric, allowing us to assess the trade-off between recall and query speed based on ground-truth similarity.
4.2 Impact of the Information Loss Funnel
The existence of an information loss funnel is a key reason why improvements in synthetic metrics do not always translate into gains in task-centric metric effectiveness (Figure 4). To better understand this phenomenon, Iceberg conducts comprehensive experiments to systematically investigate three critical sources of information loss in the current end-to-end VSS pipeline. Through this analysis, we aim to address RQ1 : How does information loss impact task-centric metrics utility in vector similarity search applications? To illustrate our key findings, we present a partial subset of representative results in this section. The full set of experimental results, covering all observation dimensions, is available on our benchmark website.
O1 (Embedding Process): Information loss first occurs during the transformation from raw data to embeddings. This loss canuntie the semantic similarity with spatial closeness under given distance metrics, making the pursue for high synthetic recall meaningless. Our experiments reveal a consistent gap between synthetic metrics and true downstream task performance. First , as shown in Table 4, we observe that downstream utility (label recall@100) exhibits a natural upper bound, even when synthetic recall approaches 100%. For instance, on the ImageNet dataset with
| Metric | Method | ImageNet-DINOv2 (Label Recall@100) | Glink360K-ViT (Label Recall@100) |
|---|---|---|---|
| IP ED | Fargo ScaNN ip-NSW ip-NSW+ Mobius NAPG MAG RaBitQ IVFPQ DB-LSH HNSW | 71.38% 71.42% 71.4% 71% 71.3% 71.4% 71.4% 71.2% 71.2% 71% 71.17% | 90.3% 90.5% 90.4% 90.3% 88.9% 90.38% 90.5% 90.3% 89% 90.2% 90.29% |
DINOv2 embeddings, label recall@100 saturates at 71% despite vector recall@100 reaching 99.9%. A similar bottleneck is observed in the Glink360K-ViT dataset, where label recall@100 plateaus at 91% while synthetic recall is nearly perfect. This indicates that high VSS synthetic accuracy does not necessarily translate into better task performance. Second , on the Commerce dataset, we find a non-monotonic relationship between synthetic metrics accuracy and downstream task-centric utility (Figure 5). As synthetic recall improves, the matching score@100-a task-specific measure of user interest-initially increases but then declines. This counterintuitive trend shows that relying too heavily on synthetic measures without considering their practical implications can lead to misleading conclusions. Finally , Table 5 shows that downstream task-centric utility is highly sensitive to the choice of embedding model. Using DINOv2 , EVA02 , ConvNeXt , and AlexNet on ImageNet, we observe significant differences in label recall@100 under the same retrieval setting (all with 99% synthetic recall). While DINOv2 achieves only 71%, EVA02 and ConvNeXt reach 85% and 84%, respectively. Furthermore, representations from the old embedding model diverge more from task-centric retrieval targets. AlexNet -based embeddings achieved only about 21% accuracy on label recall, suggesting that neglecting downstream evaluation on outdated embeddings leads to increasingly misaligned and less meaningful retrieval results.
We attribute this phenomenon to information loss in the representation space, which is closely related to concepts such as neural collapse [57] and representation collapse [19, 43]. Such representation collapse reflects an Occam's razor principle: the model will only retain information useful for predicting the labels. However, in many domains of machine learning, the optimization objective of the model doesn't always facilitate a metric-preserving projection over the whole sample space. For example, classification loss only fits the training data to the training labels, suffering from generalization errors to test space. Contrastive learning aligns the metric structure of extracted vectors among selected positive and negative samples (usually applying in-batch sampling), not the whole sample
space. After training on a dataset, different amount of information will be lost according to different loss design, needless to say the model capacity. To focus on VSS , we don't aim to propose solutions to this problem and leave it to the machine learning community.
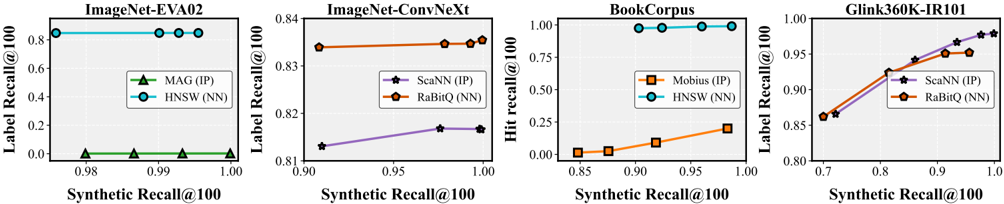
O2 (Metric Choice): The second layer of the information loss funnel is metric misuse, a critical issue in real-world applications where inappropriate similarity metrics for VSS render even high synthetic recall ineffective for task-centric gains. This issue is prevalent and often overlooked when evaluating VSS systems solely based on synthetic metrics. Figure 6 shows the trend of task-centric performance as synthetic recall varies on representative datasets, using the best-performing methods from both the ANNS and MIPS domains .
Figure 6 reports results across four datasets: ImageNet-EVA02 , ImgeNet-ConvNeXt , BookCorpus , and Glink360-IR101 , demonstrating how the similarity metric choice radically impacts downstream task-centric performance. On ImageNet , with ConvNeXt embeddings, ANNS using Euclidean distance scores roughly 4% higher label recall@100 than MIPS , even though both are run at synthetic recall@100 around 99.9%. The problem is more pronounced with the EVA02 model: even though MIPS achieves nearly perfect synthetic recall@100 (99.99%), actual task-centric label recall@100 is stubbornly below 1%, reflecting a near-complete semantic mismatch. Analogously, on the text retrieval dataset BookCorpus , MIPS manages less than 50% task-centric hit recall, whereas Euclidean-based ANNS attains 100%. However, the Glink360-IR101 dataset shows the opposite. Here, MIPS comfortably outperforms Euclidean-based ANNS on task-centric metrics: with Glink360K-IR101 embeddings, MIPS performs 98% label recall@100, whereas HNSW ( ANNS methods) tops out at 92%. Given the high-stakes nature of applications such as identity verification, such performance discrepancies result in critical system failures-even with high synthetic recall.
These differences in performance are due to mismatched similarity measures and embedding space geometries, controlled through loss design and metric affinity . Models such as ConvNeXt are trained with cross-entropy loss, which promotes embeddings within the same class to have tight clusters in Euclidean space. Euclidean distance naturally captures this structure. By contrast, MIPS is sensitive to both direction and norm of vectors and does not respect this clustering, retrieving semantically unrelated neighbors despite high synthetic recall. Glink360K-IR101 embeddings are trained with ArcFace , which employs an Additive Angular Margin Loss to foster a highly discriminative angular structure-small intra-class angles
and large inter-class angles. This structure is naturally captured by inner product similarity, and thus MIPS is the correct choice and we see why it has superior task-centric performance on Glink360 . Combined, these results highlight an important takeaway: Evaluating synthetic recall with a single similarity metric (like Euclidean distance) can be misleading and, unless that metric is aligned with the training loss, largely meaningless. Metric choice materially affects outcomes: metric misuse not only incurs drastic information loss but also can make high-synthetic recall VSS systems functionally useless in real-world downstream tasks.
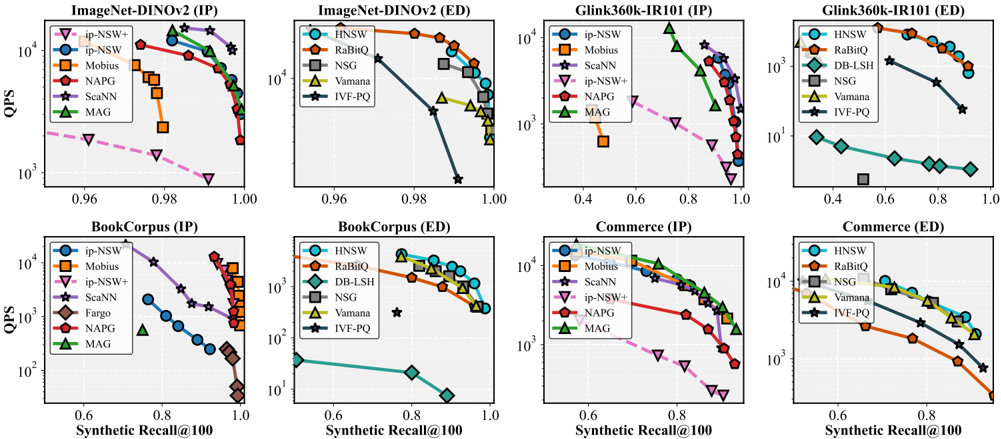
O3 (Data Distribution Sensitivity): Each data distribution has methods best suited to its properties or structures, and choosing an unsuitable method can cause retrieval efficiency to drop and result in information loss, contributing the third layer of information loss funnel. We categorize the methods into two classes-partition-based and graph-based methods (§3.2 for details)-and conduct extensive evaluations on four datasets from different domains for both ANNS and MIPS tasks. The experimental results are presented in Figure 7.
O-3.1: Partition- and graph-based methods have their own strengths. In traditional benchmarks [11, 67], it is commonly assumed that graph-based methods significantly outperform other types of methods in in-memory settings. This belief has led many commercial vector search systems to prioritize graph-based methods by default (e.g., AnalyticDB [68]), regardless of the application. However, this assumption does not always hold true. A VSS method's efficiency heavily relies on the data distribution. Experimental results demonstrate query performance on a synthetic metric.
As shown in Figures 6, the partition-based methods exhibit a clear performance advantage in certain datasets, particularly on the ImageNet-DINOv2 and Glink360K-IR101 . In the MIPS setting, ScaNN significantly outperforms the leading graph-based method on these datasets, achieving speedups of 1.7 × and 3 × , respectively, while maintaining comparable synthetic metric recall. A similar advantage is observed in the ANNS setting: on Glink360K-IR101 , RaBitQ delivers nearly 2 × faster query speed than HNSW at equivalent synthetic metric recall. In contrast, graph-based methods perform better on BookCorpus and Commerce . In the MIPS experiments on synthetic metric, the top-performing graph-based index achieves up to 3 × faster speed than ScaNN on Commerce , and up to 4 × on BookCorpus . A similar trend is seen in the ANNS setting: HNSW outpaces the strongest partition-based competitor, RaBitQ , by 2.7 × and 3.2 × on BookCorpus and Commerce , respectively.
| Model | HNSW | RaBitQ | ||||
|---|---|---|---|---|---|---|
| Synthetic Recall@100 | Synthetic Recall@100 | |||||
| 90% | 95% | 99% | 90% | 95% | 99% | |
| AlexNet | 21.62% | 21.48% | 21.43% | 22.55% | 22.43% | 22.41% |
| DINOv2 | 70.5% | 71.08% | 71.17% | 70.08% | 71.2% | 71.24% |
| EVA02 | 80.1% | 83.7% | 84.9% | 84.4% | 84.76% | 84.82% |
| ConvNeXt | 82.5% | 82.7% | 83.3% | 83.46% | 83.46% | 83.54% |
The performance differences are attributed to the sensitivity of the methods to data properties. For example, when shapes in the data are strongly cluster-like, graph-based methods are liable to get trapped in local optima among clusters, which discourages them from finding the relevant areas [61]. Similarly, when angles between vectors are large, edge pruning methods based on the triangle inequality (e.g., HNSW , NSG ) increasingly fail to sparsift the graph while maintaining connectivity. Partition-based methods are inherently dependent on data characteristics as well: whether they use clustering or hash-based projections, their quality can significantly vary from one dataset to another [29].
O-3.2: Wrong choice leads to performance degradation. Beyond the query speed disparities on synthetic metric, the impact of selecting an unsuitable method is more critical-it can constrain synthetic metric recall and downstream task-centric performance, ultimately causing significant information loss. This phenomenon is particularly pronounced in the domain of MIPS . Due to the lack of rigorous theoretical foundations, some methods suffer from synthetic metric recall bottlenecks and performance degradation on certain datasets. For example, while the Mobius algorithm performs well on some datasets (e.g., BookCorpus ), it fails to exceed 50% accuracy on synthetic metric recall@100 on the Glink360K-IR101 dataset. Similarly, partition-based methods such as ScaNN exhibit noticeable performance drops on the Commerce dataset when the target synthetic metric recall exceeds 90%. These findings highlight that variations in data distribution can lead to different degrees of information loss across methods.
Information Loss Funnel Analysis. Having identified the information loss funnel's layered structure through extensive analysis, we qualitatively assess each layer's contribution. Layer 1 (Embedding loss) defines the upper bound of task-centric performance, as the transformation from raw data to embeddings inevitably discards fine-grained semantics. Layer 2 (Metric misuse) exerts a decisive impact on retrieval accuracy, where metric misalignment undermines the correlation between synthetic recall and task-centric metric. Layer 3 (Distribution sensitivity) primarily shapes retrieval efficiency, though its impact on task-centric metrics, albeit smaller, remains non-trivial. Overall, the first two layers dominate taskcentric accuracy, while the third governs computational scalability. We now revisit key VSS applications' information loss within this evaluation framework.
Image Classification. Layer 1: Image classification models, both supervised and self-supervised, extract representations but do not achieve perfect task-centric accuracy due to data complexity and model limitations (Table 5). Layer 2: Representations in image classification tasks tend to align well with Euclidean space, as their embedding models are typically trained with cross-entropy loss, which encourages embeddings of the same class to form compact clusters in Euclidean space. Layer 3: Different methods show inconsistent performance between synthetic and downstream tasks, leading to information loss in method selection.
Face Recognition. Layer 1: ArcFace-based models may encounter a task-centric accuracy ceiling in downstream tasks due to architectural constraints on representation learning (Table 4). Layer 2: Inner product metrics are better suited for face recognition due to the use of Additive Angular Margin Loss, which promotes a discriminative angular structure. Layer 3: Graph-based methods are more prone to local optima than partition-based methods, reducing their effectiveness on synthetic metric tasks (Figure 7).
Text Retrieval. Layer 1: Current text representation models exhibit some distortion when extracting information from paragraphs. Layer 2: Incorrect metric choice, such as inner product, can reduce task-centric Hit@K performance to under 50% (Figure 6). Layer 3: Due to the difficulty in distinguishing boundary points, partitionbased methods are more prone to information loss in synthetic task retrieval than graph-based methods.
Recommendation. Layer 1: ResFlow struggles to strongly correlate synthetic and task-centric tasks, leading to significant information loss (Figure 5). Layer 2: Euclidean distance and inner product metrics show an initial performance improvement followed by a decline in downstream tasks, because models are trained on historical user-item interactions, a user vector's nearest items are typically those already purchased; with repurchases rare, optimizing for such neighbors yields limited real-world benefit. Layer 3: Partition-based methods suffer retrieval performance degradation in synthetic metrics (Figure 7).
4.3 Decision Tree For Method Selection
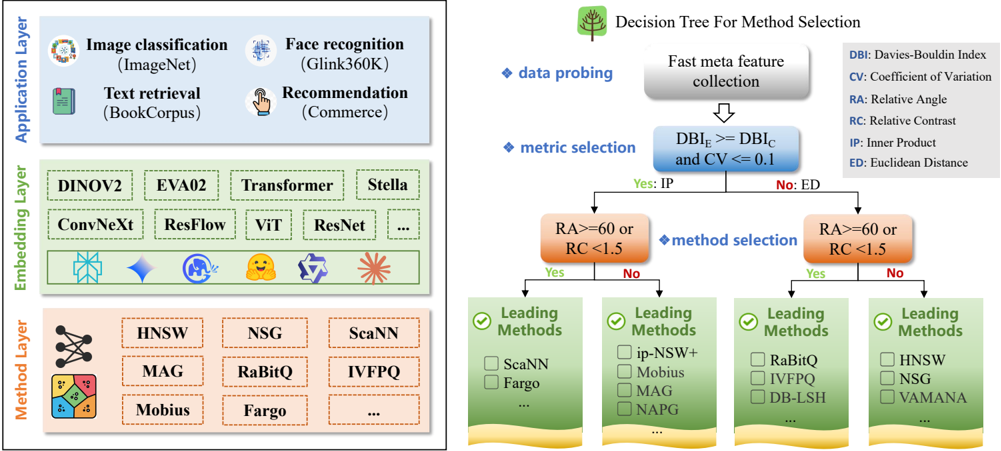
According to above funnel analysis, we still wish to propose a guide in VSS method selection even with hands tied (embedding model capacity bottleneck). Here we delve into the philosophy behind selecting an appropriate similarity metric and VSS method under the framework of the information loss funnel, aiming to addressing RQ2 : How to select the most suitable vector similarity search method considering the information loss funnel? There are two key factors in choosing the best method: one is selecting the metric that best aligns with the downstream task, and the other is choosing the method that performs best under that metric. To operationalize this, we construct a two-layer interpretable decision tree model based on four meta-features. In the first layer, we prioritize metric selection, as aligning the metric with the downstream task is critical for preserving task-centric accuracy. In the second layer, we use data distribution-related meta-features to further distinguish between methods, enabling the selection of the most effective method for each dataset. The meta-features are in Table 6.
O4 (First Layer: Selecting Metric): The initial layer of our decision tree focuses on selecting the most suitable similarity
| Dataset | DBI 𝐸 | DBI 𝐶 | CV | RA | RC |
|---|---|---|---|---|---|
| ImageNet-DINOv2 | 3.04 | 1.61 | 0.02 | 83 | 1.98 |
| ImageNet-EVA02 | 5.35 | 6.42 | 0.02 | 3 | 1.59 |
| ImageNet-ConvNeXt | 1.4 | 1 | 0.36 | 81 | 3.6 |
| Glint360K-ViT | 4.27 | 2.26 | 0.04 | 91 | 142 |
| Glint360K-IR101 | 5.51 | 2.09 | 0.08 | 87 | 1.38 |
| BookCorpus | 4.5 | 9.7 | 0.13 | 44 | 75 |
| Commerce | 2.68 | 2.35 | 0.00 | 38 | 3 |
metric for a given embedding space: either IP or Euclidean distance. This choice is critical as it directly impacts the downstream task-centric utility. Given the discussion in §4.2, the embedding model domain evolves fast and usually does not offer clues on how is the affinity of their method with downstream retrieval tasks. However, with exhaustive research, we manage to capture affinity patterns between data distribution property or structure with different metrics used for VSS . Our decision rule for metric selection is based on the combined assessment of the DBI and CV as follows.
- Davies-Bouldin Index ( DBI ): DBI measures cluster compactness and separation in the embedding space; lower values indicate better clustering quality and can be computed using either Euclidean distance ( DBI 𝐸 ) or cosine similarity ( DBI 𝐶 ).
where 𝑁 denotes the number of clusters, 𝜎 𝑖 denotes the intracluster distance of cluster 𝑖 , 𝑐 𝑖 and 𝑐 𝑗 denote cluster centers, and 𝑑 ( 𝑐 𝑖 , 𝑐 𝑗 ) denotes the distance between cluster centers.
- Coefficient of Variation ( CV ): It quantifies embedding vector norm variability; a lower CV indicates more consistent norms. This is typical in training with norm normalization (e.g., contrastive learning), which mitigates the impact of vector norms on model behavior.
Here 𝜎 (∥ 𝑥 ∥) is the standard deviation of vector norms. E (∥ 𝑥 ∥) is the mean norm over the dataset.
The datasets opt for IP as the similarity metric when the condition ( 𝐷𝐵𝐼 𝐸 ≥ 𝐷𝐵𝐼 𝐶 ) ∧ 𝐶𝑉 ≤ 0 . 1 is satisfied. This condition suggests that clusters in the embedding space are more distinguishable in angular terms than in Euclidean space, and that the embedding vectors exhibit relatively uniform norms. This distribution prioritizes angular information, indicating semantic similarity and supporting MIPS more effectively, meaningfully retaining taskrelevant details downstream. Our findings corroborate this: on the Glint360K-IR101 dataset ( 𝐷𝐵𝐼 𝐸 = 5 . 51, 𝐷𝐵𝐼 𝐶 = 2 . 09, 𝐶𝑉 = 0 . 08), IP achieves a 4% higher label recall@100 compared to ANNS , which is a notable boost for face recognition. Otherwise, we opt for Euclidean distance instead. In that case, the data has more Euclidean clustering, and high CV indicates there is large norm variation in vectors. This biases IP similarity towards norm variations instead of semantic relevance and downstream task performance thus suffers.
O5 (Second Layer: Selecting Algrithm): Our second layer thus chooses the best VSS method for an embedding space and a chosen similarity metric. Mainstream VSS engines predominantly employ either partition-based or graph-based methods, which differ significantly in their strategies. However, method choice is connected to information loss and data distribution structures too. Our decision rule is subject to RA and RC .
- Relative Angle ( RA ): It measures the average angular relationships between embedding vectors, where a larger RA value indicates greater angular dispersion within the dataset.
where v 𝑖 is an embedding vector from the dataset of 𝑁 vectors, C = 1 𝑁 ˝ 𝑁 𝑖 = 1 v 𝑖 is the global mean vector, and 𝜖 is a small positive constant for numerical stability.
- Relative Contrast ( RC ): It measures a dataset's relative density in high-dimensional space; higher values suggest a more dispersed distribution.
Here, 𝐷 𝑣 𝑖 min represents the distance from vi to its approximate nearest neighbor, and 𝐷 𝑣 𝑖 mean is the mean distance from vi to vectors (random sampled) in dataset.
The datasets favor partition-based methods when the condition RA ≥ 60 ∨ RC ≤ 1 . 5 is met . Both RA and RC play critical roles in determining the search navigability of graph-based indexing methods. A low RA indicates strong cluster segregation, leading to poor global connectivity in the graph and causing searches to get stuck in local optima. High angular dispersion further weakens triangle inequality pruning, degrading proximity graph quality. Similarly, a low RC suggests that local neighbors have similar distances, reducing structural discriminability and diminishing the effectiveness of graph-based guidance during search. In such conditions, partition-based methods perform more efficiently. By detecting spatial divisions in the data, they restrict computation to relevant regions during querying and benefit from batch processing. As shown in Figure 6, on the Face-IR101 dataset ( RA = 87, RC = 1.38), ScaNN achieves 3 × lower query latency than the state-of-the-art graph-based method ip-NSW , while maintaining comparable synthetic recall. Conversely, graph-based methods excel when RA is high and RC is moderate. Better connectivity and sparsity enable effective edge pruning, and the power-law structure of the graph allows greedy search to traverse efficiently. A high RC improves search quality by reducing redundancy and enhancing guidance. For instance, HNSW outperforms RaBitQ by 3.7 × in query speed on the BookCorpus at synthetic recall@100 = 0.95.
Threshold analysis. Our distribution-related threshold conclusions are supported by diverse datasets and reported under the confidence interval lower bound, which provides strong tolerance and generalizability. For example, ( CVIP = [ 0 . 02 , 0 . 04 , 0 . 08 , 0 . 00 ]) yielded a 95% upper confidence bound of 0.1019 , whereas the ED
| Synthetic Recall Ranking | Task-Centric Ranking | ||||||
|---|---|---|---|---|---|---|---|
| ANNS (for ED) | MIPS (for | ||||||
| Datasets | method Type | Winner | method Type | Winner | Metric | method Type | Winner |
| ImageNet-DINOv2 | Partition | RaBitQ | Partition | ScaNN | IP | Partition | ★ ScaNN |
| ImageNet-EVA02 | Graph | HNSW | Graph | MAG | ED | Graph | ★ HNSW |
| ImageNet-ConvNeXt | Graph | HNSW | Partition | ScaNN | ED | Partition | ★ RaBitQ |
| Glint360K-ViT | Graph | HNSW | Partition | ScaNN | IP | Partition | ★ ScaNN |
| Glint360K-IR101 | Partition | RaBitQ | Partition | ScaNN | IP | Partition | ★ ScaNN |
| BookCorpus | Graph | HNSW | Graph | Mobius | ED | Graph | ★ HNSW |
| Commerce | Graph | VAMANA | Graph | MAG | IP | Graph | ★ ip-NSW+ |
subset ( CVED = [ 0 . 36 , 0 . 13 , 0 . 02 ]) produced a 95% lower bound of -0.1700 . The overlap between their confidence intervals motivated a conservative threshold of CV = 0 . 10, ensuring class separability. In current ML practice, Transformer-based embeddings have largely unified representation models, and with the emergence of more large-scale labeled datasets, we expect both representation methods and thresholds to further converge.
Summary. Following the decision tree partitioning, each dataset and method can be routed to a specific leaf node, where the most appropriate method is selected accordingly. Our information-loss funnel is designed as a general diagnostic model, and the current decision tree is fitted to existing models and datasets. The decision tree structure and dataset-method mapping, is shown in Figure 2.
4.4 Iceberg Leaderboard 1.0
In this section, we present a task-centric leaderboard produced by Iceberg . Our evaluation spans all eight benchmark datasets, jointly assessing synthetic metrics and downstream utility to reveal the performance of the methods across these datasets. We aim to address RQ3 : What is the realistic ranking of the methods in terms of synthetic metrics and task-centric metrics utility comparison?
Parameter Configuration. Most methods do not allow the user to explicitly specify a quality target. In the Iceberg , we first use a consistent configuration for key shared parameters across methods of the same type. For graph-based methods, we set the two most critical parameters as follows: EFC (queue length during graph construction) is set to 256, and M (maximum number of edges) is set to 32. For partition-based methods that rely on clustering methods ( ScaNN , IVFPQ , and RaBitQ ), we set the number of clusters C to 4 √ 𝑁 , where 𝑁 is the number of vectors. Then, we carefully apply grid search to fine-tune the method-specific parameters based on the recommended settings from the original papers. The detailed settings can be found on the framework's website.
O6 (Leaderboard): Iceberg integrates downstream utility into the evaluation, delivering an end-to-end method ranking that serves as an intuitive and actionable method selection guidance for users. We observe that the realistic performance rankings do not always align with those derived solely from synthetic metrics. For example, although MAG attains higher synthetic recall at lower latency, its best task-centric score still lags behind ip-NSW+ , making the latter the overall winner. The leaderboard is summarized in Table 7. Users may reproduce these results by selecting the optimal algorithm along the synthetic recall-QPS and task-centric recall-QPS curves.
4.5 Insights & Future Directions
In this section, we start from the perspective of the information loss funnel and leverage visualization analysis techniques to further explore insights behind the performance improvements in vector similarity search. Our analysis focuses on three key aspects: taskaware, metric-aware, and distribution-aware perspectives, aiming to answer RQ4 : What insights can guide the performance optimization of vector similarity search across different scenarios?
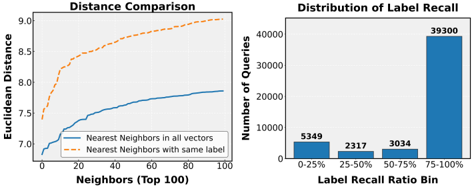
O7 (Task-aware Improvement): Task-aware VSS can help align vector similarity search with downstream tasks. As shown in Figure 8, the left part illustrates that in the ImageNetConvNeXt dataset, the nearest neighbors of a query based solely on Euclidean distance are not necessarily those sharing the same label. In some cases, instances with the same label are located relatively far from the query. The right part presents a global statistical view, revealing that a notable portion of queries fail to exhibit wellaligned distance-label relationships. These observations suggest that further development of task-aware VSS is promising.
Future Direction. Given the diversity of real-world applications, future work should focus on developing adaptable, task-aware VSS techniques that generalize across models and tasks while minimizing system overhead. For example, to address this issue, we can incorporate a VSS method with a task-aware early-stop strategy where label-recall saturates or focus the search within a task-aware proximity range. A more promising future work is to co-optimize indexing and search methods with downstream tasks in mind. When optimizing both the representation learning, VSS components, and
downstream tasks together in an end-to-end framework, it is possible to more closely align learned embeddings and VSS mechanisms, make downstream tasks more effective, and minimize information loss accumulated along the pipeline. Such a synergistic design is particularly important in complex, large-scale AI applications.
O8(Metric-aware Improvement): Metric-aware VSS is a breakthrough approach to enhancing VSS performance. Iceberg has identified the link between similarity metrics and downstream task effectiveness. However, most existing methods are tailored to a single metric, limiting their adaptability. Recent work such as the MAG [17] demonstrates initial progress by supporting both IP and NN within a single index, enabling cross-metric retrieval and improving the usability of VSS . Nevertheless, these methods still rely on manual tuning and cannot fully bridge the geometric differences across metric spaces.
Future Direction. Akeyfuture direction for VSS is developing metricaware methods that can adapt to various similarity spaces-inner product, Euclidean, and non-Euclidean-without manual tuning. As embedding objectives and architectures grow more diverse and model training does not necessarily indicate which distance metric should be used, fixed-metric approaches become increasingly suboptimal. Overcoming this "metric barrier" calls for self-adaptive methods capable of automatically identifying and adjusting to the appropriate similarity metric. While MAG marks early progress, their reliance on manual tuning and limited support for complex metrics highlights the need for more flexible solutions, especially given their performance gap with metric-specific methods like ScaNN on certain datasets.
O9 (Distribution-aware Improvement) The heterogeneous pattern distributions of diverse vector datasets inherently challenge traditional VSS methods that rely on fixed construction strategies. Such methods have poor generalizability to datasets with varied geometric properties. For example, in the Glink360K dataset, as shown in Figure 9(left), K-means clustering is performed in the original space, followed by PCA methods for 3D visualization, where data points are separated by cluster labels. The dataset showcases extreme angular separation: inter-class distances are large, while intra-class distances have high variability, thus severely crippling the usefulness of graph-based indices. For the BookCorpus dataset, an analogous dimensionality reduction method was used, with the data points colored according to their
norms. Figure 9(right) shows that the average angle between vectors is kept within 60 degrees, and the data is scattered along multiple norm directions. In such scenarios, graph-based methods can effectively leverage the triangle inequality for pruning edges. However, partition-based approaches struggle to create clear boundaries between partitions, making it difficult to exactly identify border points. This limitation negatively impacts their ability to achieve high synthetic metric recall efficiently.
Future Direction. A key direction for future research lies in designing distribution-aware VSS methods that can adapt to the geometric characteristics of data. Since we can identify effective statistical indicators to divide different methods into different nodes of the decision tree (Figure 2), this means the current design of VSS methods "overfit" certain data distribution and metric. Thus, this literature may eagerly expect the emergence of "cross-node" VSS methods. Although some research efforts have proposed hybrid methods that combine graph and clustering techniques [16], such approaches are predominantly heuristic and lack concrete guidelines and adaptive mechanisms across diverse datasets. This highlights significant optimization opportunities, from automatically tuning index parameters and adaptively stitching methods to achieving fully dynamic and distribution-sensitive VSS mechanisms.
5 Discussion
This section focuses on the lessons we have learned from Iceberg , as well as the current limitations that still remain.
Lessons Learned. We summarized three key lessons. Lesson 1: Optimizing only for synthetic is insufficient since information is progressively lost across the VSS pipeline, and method improvements often fail to yield task-centric gains. End-to-end evaluation is essential to bridge the gap between academic benchmarks and real-world effectiveness. Lesson 2: Metric misuse and suboptimal method choices are major, yet avoidable, sources of information loss. A better understanding of embedding distributions can guide more effective alignment between models, metrics, and retrieval strategies. Lesson 3: Current VSS methods remain relatively isolated in the end-to-end pipeline and lack dynamic optimization tailored to real-world scenarios. There is untapped potential in developing task-aware , metric-aware , and distribution -aware retrieval strategies that dynamically adapt to real-world deployment needs.
Limitation. This study highlights hidden pitfalls in current retrieval methods and their implications for the future VSS , while leaving some aspects beyond its scope. (1) Euclidean distance and inner product (cosine as a special case) cover most needs while hyperbolic [28] and sparse embeddings introduce alternative metrics such as Mahalanobis distance, these remain niche directions. Given limited resources, we focus on representative tasks and will extend to such customized metrics as new needs arise . (2) It focuses on algorithmic characteristics rather than commercial system optimizations like cloud-native design or hardware heterogeneity. (3) Information loss from upstream machine learning is acknowledged as a critical issue, but no solution is proposed-it's flagged as a key area for future work. (4) The decision tree model in Iceberg is built on current AI -generated vectors, which may lead to "overfitting" as model landscapes evolve, necessitating ongoing updates, i.e., the meta-feature indicators and dividing thresholds may evolve with the literature development. As AI applications rapidly advance, future updates will incorporate emerging domains such as LLM -based agents, guided by the release of high-quality benchmark datasets.
6 Conclusion
In this paper, we presented Iceberg , a comprehensive benchmark suite explicitly designed for end-to-end evaluation of vector similarity search ( VSS ) from task-centric perspectives, which shifts the focus from synthetic evaluation to the downstream task performance. Our study identifies the information loss funnel as the primary bottleneck in VSS and systematically analyzes its underlying causes through extensive experimentation. For empirical validation, Iceberg integrates eight large-scale datasets across four major domains, eight domain-specific representation models, thirteen state-of-the-art VSS methods, four downstream task metrics, and a variety of variations. To assist practitioners, it further provides an explainable decision-tree model that guides practitioners in selecting task-appropriate VSS methods. Finally, we summarize our findings and outline directions for future research, aimed at closing the gap between academic research and production deployments.
References
- 2012. https://image-net.org/challenges/LSVRC/. Accessed: July 16, 2025.
- 2018. https://huggingface.co/gaunernst/vit_tiny_patch8_112.arcface_ms1mv3. Accessed: July 16, 2025.
- 2018. https://huggingface.co/minchul/cvlface_arcface_ir101_webface4m. Accessed: July 16, 2025.
- 2022. https://huggingface.co/timm/convnext_large_mlp.clip_laion2b_soup_ft_ in12k_in1k_384. Accessed: July 16, 2025.
- 2023. https://huggingface.co/facebook/dinov2-base. Accessed: July 16, 2025.
- 2023. https://huggingface.co/timm/eva02_large_patch14_448.mim_m38m_ft_ in22k_in1k. Accessed: July 16, 2025.
- 2023. https://paperswithcode.com/dataset/glint360k. Accessed: July 16, 2025.
- 2024. https://github.com/FuCongResearchSquad/ResFlow. Accessed: July 16, 2025.
- 2025. https://huggingface.co/NovaSearch/stella_en_1.5B_v5. Accessed: July 16, 2025.
- Cecilia Aguerrebere, Ishwar Singh Bhati, Mark Hildebrand, Mariano Tepper, and Theodore Willke. 2023. Similarity Search in the Blink of an Eye with Compressed Indices. Proceedings of the VLDB Endowment 16, 11 (2023), 3433-3446. https://doi.org/10.14778/3611479.3611537.
- Martin Aumüller, Erik Bernhardsson, and Alexander Faithfull. 2020. ANNBenchmarks: A benchmarking tool for approximate nearest neighbor algorithms. Information Systems 87 (2020), 101374. https://doi.org/10.1016/j.is.2019.02.006.
- Ilias Azizi, Karima Echihabi, and Themis Palpanas. 2025. Graph-Based Vector Search: An Experimental Evaluation of the State-of-the-Art. Proceedings of the ACM on Management of Data 3, 1 (2025), 1-31. https://doi.org/10.1145/3709693.
- Artem Babenko and Victor Lempitsky. 2014. Additive quantization for extreme vector compression. In Proceedings of the IEEE Conference on Computer Vision and Pattern Recognition . 931-938.
- Shuai Bai, Keqin Chen, Xuejing Liu, Jialin Wang, Wenbin Ge, Sibo Song, Kai Dang, Peng Wang, Shijie Wang, Jun Tang, et al. 2025. Qwen2. 5-vl technical report. arXiv preprint arXiv:2502.13923 (2025).
- Meng Chen, Kai Zhang, Zhenying He, Yinan Jing, and X Sean Wang. 2024. RoarGraph: A Projected Bipartite Graph for Efficient Cross-Modal Approximate Nearest Neighbor Search. Proceedings of the VLDB Endowment 17, 11 (2024), 2735-2749. https://doi.org/10.14778/3681954.368195.
- Qi Chen, Bing Zhao, Haidong Wang, Mingqin Li, Chuanjie Liu, Zengzhong Li, Mao Yang, and Jingdong Wang. 2021. Spann: Highly-efficient billion-scale approximate nearest neighborhood search. Advances in Neural Information Processing Systems 34 (2021), 5199-5212.
- Tingyang Chen, Cong Fu, Xiangyu Ke, Yunjun Gao, Yabo Ni, and Anxiang Zeng. 2025. Stitching Inner Product and Euclidean Metrics for Topology-aware Maximum Inner Product Search. arXiv preprint arXiv:2504.14861 (2025).
- Tingyang Chen, Cong Fu, Kun Wang, Xiangyu Ke, Yunjun Gao, Wenchao Zhou, Yabo Ni, and Anxiang Zeng. 2025. Maximum Inner Product is Query-Scaled Nearest Neighbor. arXiv preprint arXiv:2503.06882 (2025).
- Zewen Chi, Li Dong, Shaohan Huang, Damai Dai, Shuming Ma, Barun Patra, Saksham Singhal, Payal Bajaj, Xia Song, Xian-Ling Mao, et al. 2022. On the representation collapse of sparse mixture of experts. Advances in Neural Information Processing Systems 35 (2022), 34600-34613.
- Jose A Costa, Abhishek Girotra, and AO Hero. 2005. Estimating local intrinsic dimension with k-nearest neighbor graphs. In IEEE/SP 13th Workshop on Statistical Signal Processing, 2005 . 417-422.
- Mayur Datar, Nicole Immorlica, Piotr Indyk, and Vahab S Mirrokni. 2004. Localitysensitive hashing scheme based on p-stable distributions. In Proceedings of the twentieth annual symposium on Computational geometry . 253-262.
- Jiankang Deng, Jia Guo, Niannan Xue, and Stefanos Zafeiriou. 2019. Arcface: Additive angular margin loss for deep face recognition. In Proceedings of the IEEE/CVF conference on computer vision and pattern recognition . 4690-4699.
- Matthijs Douze, Alexandr Guzhva, Chengqi Deng, Jeff Johnson, Gergely Szilvasy, Pierre-Emmanuel Mazaré, Maria Lomeli, Lucas Hosseini, and Hervé Jégou. 2024. The faiss library. arXiv preprint arXiv:2401.08281 (2024).
- Yuxin Fang, Quan Sun, Xinggang Wang, Tiejun Huang, Xinlong Wang, and Yue Cao. 2024. Eva-02: A visual representation for neon genesis. Image and Vision Computing 149 (2024), 105171. https://doi.org/10.1016/j.imavis.2024.105171.
- Hakan Ferhatosmanoglu, Ertem Tuncel, Divyakant Agrawal, and Amr El Abbadi. 2000. Vector approximation based indexing for non-uniform high dimensional data sets. In Proceedings of the ninth international conference on Information and knowledge management . 202-209.
- Cong Fu, Kun Wang, Jiahua Wu, Yizhou Chen, Guangda Huzhang, Yabo Ni, Anxiang Zeng, and Zhiming Zhou. 2024. Residual Multi-Task Learner for Applied Ranking. In Proceedings of the 30th ACM SIGKDD conference on knowledge discovery and data Mining . 4974-4985.
- Cong Fu, Chao Xiang, Changxu Wang, and Deng Cai. 2019. Fast approximate nearest neighbor search with the navigating spreading-out graph. Proceedings of the VLDB Endowment 12, 5 (2019), 461-474. https://doi.org/10.14778/3303753.3303754.
- Octavian Ganea, Gary Bécigneul, and Thomas Hofmann. 2018. Hyperbolic neural networks. NeurIPS 31 (2018).
- Jianyang Gao, Yutong Gou, Yuexuan Xu, Jifan Shi, Cheng Long, Raymond ChiWing Wong, and Themis Palpanas. 2025. High-Dimensional Vector Quantization: General Framework, Recent Advances, and Future Directions. Data Engineering (2025), 3.
- Jianyang Gao, Yutong Gou, Yuexuan Xu, Yongyi Yang, Cheng Long, and Raymond Chi-Wing Wong. 2025. Practical and asymptotically optimal quantization of high-dimensional vectors in euclidean space for approximate nearest neighbor search. Proceedings of the ACM on Management of Data 3, 3 (2025), 1-26. https://doi.org/10.1145/3725413.
- Jianyang Gao and Cheng Long. 2024. RaBitQ: quantizing high-dimensional vectors with a theoretical error bound for approximate nearest neighbor search. Proceedings of the ACM on Management of Data 2, 3 (2024), 1-27. https://doi.org/10.1145/3654970.
- Li Gao, Hong Yang, Jia Wu, Chuan Zhou, Weixue Lu, and Yue Hu. 2018. Recommendation with multi-source heterogeneous information. In Proceedings of the 27th International Joint Conference on Artificial Intelligence . 3378-3384.
- Ruiqi Guo, Philip Sun, Erik Lindgren, Quan Geng, David Simcha, Felix Chern, and Sanjiv Kumar. 2020. Accelerating large-scale inference with anisotropic vector quantization. In International Conference on Machine Learning . 3887-3896.
- Cheng-Kang Hsieh, Longqi Yang, Yin Cui, Tsung-Yi Lin, Serge Belongie, and Deborah Estrin. 2017. Collaborative metric learning. In Proceedings of the 26th international conference on world wide web . 193-201.
- Chin-Wei Huang, Milad Aghajohari, Joey Bose, Prakash Panangaden, and Aaron C Courville. 2022. Riemannian diffusion models. Advances in Neural Information
Processing Systems 35 (2022), 2750-2761.
- Qiang Huang, Jianlin Feng, Yikai Zhang, Qiong Fang, and Wilfred Ng. 2015. Query-aware locality-sensitive hashing for approximate nearest neighbor search. Proceedings of the VLDB Endowment 9, 1 (2015), 1-12.
- Suhas Jayaram Subramanya, Fnu Devvrit, Harsha Vardhan Simhadri, Ravishankar Krishnawamy, and Rohan Kadekodi. 2019. Diskann: Fast accurate billion-point nearest neighbor search on a single node. Advances in neural information processing Systems 32 (2019).
- Guoxin Kang, Zhongxin Ge, Jingpei Hu, Xueya Zhang, Lei Wang, and Jianfeng Zhan. [n. d.]. BigVectorBench: Heterogeneous Data Embedding and Compound eries are Essential in Evaluating Vector Databases. ([n. d.]).
- Noam Koenigstein, Parikshit Ram, and Yuval Shavitt. 2012. Efficient retrieval of recommendations in a matrix factorization framework. In Proceedings of the 21st ACM international conference on Information and knowledge management . 535-544.
- Alex Krizhevsky, Ilya Sutskever, and Geoffrey E Hinton. 2012. Imagenet classification with deep convolutional neural networks. Advances in neural information processing systems 25 (2012).
- Brian Kulis et al. 2013. Metric learning: A survey. Foundations and Trends® in Machine Learning 5, 4 (2013), 287-364.
- Patrick Lewis, Ethan Perez, Aleksandra Piktus, Fabio Petroni, Vladimir Karpukhin, Naman Goyal, Heinrich Küttler, Mike Lewis, Wen-tau Yih, Tim Rocktäschel, et al. 2020. Retrieval-augmented generation for knowledge-intensive nlp tasks. Advances in Neural Information Processing Systems 33 (2020), 9459-9474.
- Alexander C Li, Alexei A Efros, and Deepak Pathak. 2022. Understanding collapse in non-contrastive siamese representation learning. In European Conference on Computer Vision . 490-505.
- Wen Li, Ying Zhang, Yifang Sun, Wei Wang, Mingjie Li, Wenjie Zhang, and Xuemin Lin. 2019. Approximate nearest neighbor search on high dimensional data-experiments, analyses, and improvement. IEEE Transactions on Knowledge and Data Engineering 32, 8 (2019), 1475-1488. https://doi.org/10.1109/TKDE.2019.2909204.
- Yuangang Li, Jiaqi Li, Zhuo Xiao, Tiankai Yang, Yi Nian, Xiyang Hu, and Yue Zhao. 2024. Nlp-adbench: Nlp anomaly detection benchmark. arXiv preprint arXiv:2412.04784 (2024).
- Jie Liu, Xiao Yan, Xinyan Dai, Zhirong Li, James Cheng, and Ming-Chang Yang. 2020. Understanding and improving proximity graph based maximum inner product search. In Proceedings of the AAAI Conference on Artificial Intelligence , Vol. 34. 139-146.
- Yingfan Liu, Jiangtao Cui, Zi Huang, Hui Li, and Heng Tao Shen. 2014. SK-LSH: an efficient index structure for approximate nearest neighbor search. Proceedings of the VLDB Endowment 7, 9 (2014), 745-756.
- David G Lowe. 2004. Distinctive image features from scale-invariant keypoints. International journal of computer vision 60 (2004), 91-110.
- Kejing Lu, Mineichi Kudo, Chuan Xiao, and Yoshiharu Ishikawa. 2021. HVS: hierarchical graph structure based on voronoi diagrams for solving approximate nearest neighbor search. Proceedings of the VLDB Endowment 15, 2 (2021), 246-258. https://doi.org/10.14778/3489496.3489506.
- Hengzhao Ma, Jianzhong Li, and Yong Zhang. 2024. Reconsidering Tree based Methods for k-Maximum Inner-Product Search: The LRUS-CoverTree. In 2024 IEEE 40th international conference on data engineering .
- Yu A Malkov and Dmitry A Yashunin. 2018. Efficient and robust approximate nearest neighbor search using hierarchical navigable small world graphs. IEEE transactions on pattern analysis and machine intelligence 42, 4 (2018), 824-836. https://doi.org/10.1109/TPAMI.2018.2889473.
- Yusuke Matsui, Yusuke Uchida, Hervé Jégou, and Shin'ichi Satoh. 2018. A survey of product quantization. ITE Transactions on Media Technology and Applications 6, 1 (2018), 2-10. https://doi.org/10.3169/mta.6.2.
- Stanislav Morozov and Artem Babenko. 2018. Non-metric similarity graphs for maximum inner product search. Advances in Neural Information Processing Systems 31 (2018).
- Niklas Muennighoff, Nouamane Tazi, Loic Magne, and Nils Reimers. 2023. MTEB: Massive Text Embedding Benchmark. In Proceedings of the 17th Conference of the European Chapter of the Association for Computational Linguistics . 2014-2037.
- Maxime Oquab, Timothée Darcet, Théo Moutakanni, Huy Vo, Marc Szafraniec, Vasil Khalidov, Pierre Fernandez, Daniel Haziza, Francisco Massa, Alaaeldin El-Nouby, et al. 2024. DINOv2: Learning Robust Visual Features without Supervision. Transactions on Machine Learning Research Journal (2024), 1-31. https://dx.doi.org/10.48550/arxiv.2304.07193.
- James Jie Pan, Jianguo Wang, and Guoliang Li. 2024. Survey of vector database management systems. The VLDB Journal 33, 5 (2024), 1591-1615. https://doi.org/10.1007/s00778-024-00864-x.
- Vardan Papyan, XY Han, and David L Donoho. 2020. Prevalence of neural collapse during the terminal phase of deep learning training. Proceedings of the National Academy of Sciences 117, 40 (2020), 24652-24663.
- Yun Peng, Byron Choi, Tsz Nam Chan, Jianye Yang, and Jianliang Xu. 2023. Efficient approximate nearest neighbor search in multi-dimensional databases. Proceedings of the ACM on Management of Data 1, 1 (2023), 1-27. https://doi.org/10.1145/3588908.
- Parikshit Ram and Alexander G Gray. 2012. Maximum inner-product search using cone trees. In Proceedings of the 18th ACM SIGKDD international conference on Knowledge discovery and data mining . 931-939.
- Parikshit Ram and Kaushik Sinha. 2019. Revisiting kd-tree for nearest neighbor search. In Proceedings of the 25th ACM SIGKDD conference on knowledge discovery and data mining . 1378-1388.
- Jiancheng Ruan, Tingyang Chen, Renchi Yang, Xiangyu Ke, and Yunjun Gao. 2025. Empowering Graph-based Approximate Nearest Neighbor Search with Adaptive Awareness Capabilities. arXiv preprint arXiv:2506.15986 (2025).
- Tara Safavi and Danai Koutra. 2020. Codex: A comprehensive knowledge graph completion benchmark. arXiv preprint arXiv:2009.07810 (2020).
- Anshumali Shrivastava and Ping Li. 2014. Asymmetric LSH (ALSH) for sublinear time maximum inner product search (MIPS). In Advances in neural information processing systems . 2321-2329.
- Harsha Vardhan Simhadri, George Williams, Martin Aumüller, Matthijs Douze, Artem Babenko, Dmitry Baranchuk, Qi Chen, Lucas Hosseini, Ravishankar Krishnaswamny, Gopal Srinivasa, et al. 2022. Results of the NeurIPS'21 challenge on billion-scale approximate nearest neighbor search. In NeurIPS 2021 competitions and demonstrations track . 177-189.
- Shulong Tan, Zhaozhuo Xu, Weijie Zhao, Hongliang Fei, Zhixin Zhou, and Ping Li. 2021. Norm adjusted proximity graph for fast inner product retrieval. In Proceedings of the 27th ACM SIGKDD Conference on Knowledge Discovery & Data Mining . 1552-1560.
- Yao Tian, Xi Zhao, and Xiaofang Zhou. 2023. DB-LSH 2.0: Localitysensitive hashing with query-based dynamic bucketing. IEEE Transactions on Knowledge and Data Engineering 36, 3 (2023), 1000-1015. https://doi.org/10.1109/TKDE.2023.3295831.
- Mengzhao Wang, Xiaoliang Xu, Qiang Yue, and Yuxiang Wang. 2021. A comprehensive survey and experimental comparison of graph-based approximate nearest neighbor search. arXiv preprint arXiv:2101.12631 (2021).
- Chuangxian Wei, Bin Wu, Sheng Wang, Renjie Lou, Chaoqun Zhan, Feifei Li, and Yuanzhe Cai. 2020. Analyticdb-v: A hybrid analytical engine towards query fusion for structured and unstructured data. Proceedings of the VLDB Endowment 13, 12 (2020), 3152-3165.
- Jiuqi Wei, Botao Peng, Xiaodong Lee, and Themis Palpanas. 2024. DET-LSH: A Locality-Sensitive Hashing Scheme with Dynamic Encoding Tree for Approximate Nearest Neighbor Search. Proceedings of the VLDB Endowment 17, 9 (2024), 2241-2254. https://doi.org/10.14778/3665844.3665854.
- Sanghyun Woo, Shoubhik Debnath, Ronghang Hu, Xinlei Chen, Zhuang Liu, In So Kweon, and Saining Xie. 2023. Convnext v2: Co-designing and scaling convnets with masked autoencoders. In Proceedings of the IEEE/CVF conference on computer vision and pattern recognition . 16133-16142.
- Xi Zhao, Bolong Zheng, Xiaomeng Yi, Xiaofan Luan, Charles Xie, Xiaofang Zhou, and Christian S Jensen. 2023. FARGO: Fast maximum inner product search via global multi-probing. Proceedings of the VLDB Endowment 16, 5 (2023), 1100-1112.
- Zhixin Zhou, Shulong Tan, Zhaozhuo Xu, and Ping Li. 2019. Möbius transformation for fast inner product search on graph. Advances in Neural Information Processing Systems 32 (2019).