Contents
1301.4430
User Interface Tools for Navigation in Conditional Probability Tables and Elicitation of Probabilities in Bayesian Networks
Haiqin Wang & Marek J. Druzdzel
Decision Systems Laboratory School of Information Sciences and Intelligent Systems Program University of Pittsburgh, Pittsburgh, PA 15260 {whq,marek}@sis.pitt.edu
Abstract
Elicitation of probabilities is one of the most laborious tasks in building decision-theoretic models, and one that has so far received only moderate attention in decision-theoretic sys tems. We propose a set of user interface tools for graphical probabilistic models, fo cusing on two aspects of probability elici tation: (1) navigation through conditional probability tables and (2) interactive graph ical assessment of discrete probability dis tributions. We propose two new graphical views that aid navigation in very large condi tional probability tables: the CPTREE (Con ditional Probability Tree) and the sCPT (shrinkable Conditional Probability Table). Based on what is known about graphical pre sentation of quantitative data to humans, we offer several useful enhancements to probabil ity wheel and bar graph, including different chart styles and options that can be adapted to user preferences and needs. We present the results of a simple usability study that proves the value of the proposed tools.
1 INTRODUCTION
Elicitation of numerical parameters is one of the most laborious tasks in building probabilistic models. The foremost problem is the large number of parameters required to fully quantify a model. For example, in a Bayesian network model created for diagnosis of liver disorders, HEPAR (Onisko, Druzdzel, & Wasy luk 1998), there are 94 variables: the Disorder variable with 16 outcomes, and 93 feature variables. Full quan tification of the HEPAR network required over 3, 700 numerical parameters. In most real problem domains, elicitation of numerical parameters is a dominant task in probabilistic modeling (e.g., Heckerman, Horvitz,
& Nathwani, 1992; Henrion 1989; Druzdzel & van der Gaag 1995).
Human judgement is prone to systematic errors (bi ases) that can be invoked by a variety of factors (Kahneman, Slavic, & Tversky 1982 ) . Elicitation of probabilities, if not performed carefully, can result in poor quality estimates. Behavioral decision theo rists have proposed several elicitation approaches that minimize the risk of bias. However, these methods tend to be cumbersome and often infeasible for mod els that include more than a few variables because of the large number of elicitations required. Decision an alytic practice is usually based on methods that require less effort and still protect subjective assessments from common biases.
A major obstacle to effective probability elicitation in Bayesian networks is navigation in large conditional probability tables (CPTs). In a CPT, a conditional probability distribution over a variable is required for each combination of values of its parents. The total size of the conditional probability matrix is exponen tial in the number of parents. For example, the CPT of a binary variable with n binary parents requires 2 n+l parameters. For a sufficiently large n, the 2n+1 num bers will not fit on the screen and the user will have to spend a considerable effort in navigating through them. The problem of navigation in conditional prob ability tables has not really surfaced in the field of de cision analysis, as the size of typical decision-analytic models has been limited to a handful of variables. Bayesian networks, however, quickly reach the size of tens or hundreds of variables. It is not uncommon to see a variable with as many as ten parents, which, even if each parent is binary, results in CPTs consisting of thousands of elements. Existing software packages im plementing Bayesian networks and influence diagrams have coped with the problem in various ways, few of which seems to follow established principles of good human-computer interface design. Users have to scroll back and forth to locate a particular item in a table or
a list or have to manually give the combination of par ent states in a combo box. Separate tables, applied in some solutions, require significant mental effort when users shift from one view to another.
While the problem of graphical elicitation of probabil ities is easier to cope with, our investigation into the existing implementations has also shown a lot of room for improvement. The only graphical tool for proba bility elicitation implemented seems to be the proba bility wheel, which visualizes discrete probability dis tributions in a manipulable pie-chart graph. However, probability wheel has some problems and may some times be not the best tool for graphical elicitation of probabilities. A pie chart is known to make the judge ment of part-to-part proportion difficult and is often inferior to a bar graph. Also, the labeling style applied and the overall design of interaction with the user is far from ideal in a typical implementation.
In this paper, we propose a set of tools that aim at improving navigation through large CPTs and at im proving interactive assessment of discrete conditional probability distributions. We developed two new nav igation tools: the CPTREE (conditional probability tree) and the sCPT (shrinkable conditional probabil ity table). The CPTREE is a tree view of a CPT with a shrinkable structure for any of the conditioning par ents. The sCPT is a table view of a CPT that allows to shrink any dimension of the table. Both CPTREE and sCPT allow a user to efficiently navigate through CPTs and, in particular, to quickly locate any combi nation of states of conditioning parents. We enhanced the probability wheel by providing alternative chart styles, bar graphs and pie charts, to support different kinds of proportion judgement. Our pie chart and bar graph support locking functions for those probabilities that have been elicited. Two labeling styles are pro vided: text and percentage. We use center-surround labels for the pie charts. While both tools are viable alternatives for probability elicitation, pie chart sup ports more accurate assessment of part-to-whole pro portion whereas bar graph performs better for part to-part proportion judgements. Both tools support context-specific independence and allow for elicitation of several distributions at a time, if these are identical.
The remainder of this paper is organized as follows. Section 2 offers a brief introduction to Bayesian net works and CPTs. Section 3 describes existing ap proaches to navigation in CPTs and existing imple mentations of graphical probability elicitation tools. Section 4 describes the CPTREE and sCPT and dis cusses the enhancements to the graphical elicitation tools. We report some findings from an empirical study based on the developed tools in Section 5.
2 BAYESIAN NETWORKS AND CONDITIONAL PROBABILITY TABLES
Bayesian networks (Pearl 1988) (also called belief net works, or causal networks ) are a modeling tool that allows for an explicit representation of random vari ables and probabilistic interactions among them. For mally, they are directed acyclic graphs in which nodes represent random variables and arcs represent direct probabilistic influences among them.
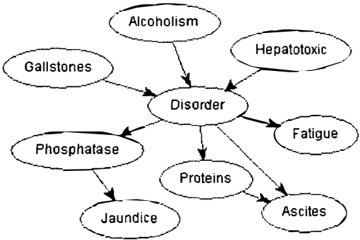
An example of a Bayesian network is given in Fig ure 1. In this network, node Disorder has three bi-
)
'--..
____..,/
Figure 1: A Simplified Fragment of the HEPAR Net work.
nary parents: Alcoholism, Hepatotoxic medications, and Gallstones, each of which is a causal factor con tributing to each of six possible liver disorders. There are five symptoms of the modeled diseases, Fatigue, Proteins, Ascites, Phosphatase and Jaundice. Each node that has no incoming arcs ( Gallstones, Alco holism, and Hepatoxic medications ) is described by a prior probability distribution over its outcomes (e.g., fractions of patients who are alcoholic and not alco holic in case of the binary node Alcoholism ) . In case of a node with incoming arcs, the network encodes its probability conditional on the outcomes of its direct predecessors (parents). For example, node Disorder is described by a probability distribution conditional on variables Alcoholism, Hepatotoxic medications, and Gallstones. Since all probabilities in our network are discrete, the conditional probability distribution is en coded as a conditional probability table (CPT). The CPT for the node Disorder is a four-dimensional table, where the first three dimensions are indexed by Dis order's parents, Alcoholism, Hepatotoxic medications, and Gallstones and the fourth dimension is indexed by the outcomes of Disorder. The elements of this CPT are conditional probabilities of outcomes of Disorder given a combination of outcomes of Alcoholism, Hepa totoxic medications, and Gallstones.
3 EXISTING GRAPHICAL TOOLS
Most of the existing probabilistic modeling systems provide graphical interface for navigation in con ditional probability tables. Some of them supply a probability wheel as a graphical tool for sub jective probability elicitation. An annotated list of these systems (including GENIE and each of the systems that we are referring to in this pa per, DATA, DPL, ERGO, HUGIN, MSBN, and NET ICA) along with links to their sites, where demon stration versions can be examined, is available on a web page maintained by the second author for the INFORMS' Society for Decision Analysis at http://www.sis.pitt.edu/�dsl/da-software.html. In this section, we analyze critically existing (at the time of this publication) graphical elicitation and nav igation tools.
3.1 NAVIGATION IN CONDITIONAL PROBABILITY TABLES
There are several existing ways of dealing with the problem of navigation in conditional probability ta bles.
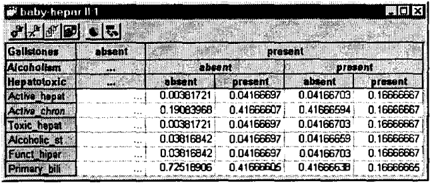
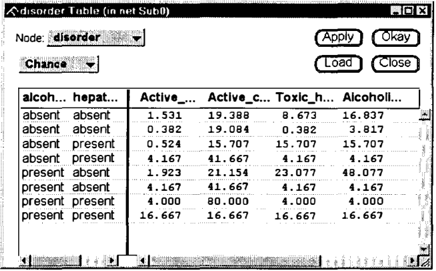
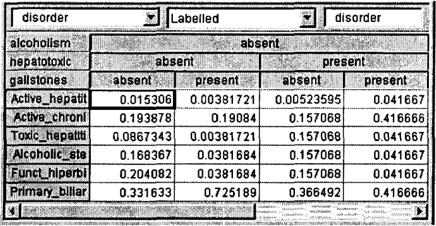
In a flat table, the solution adopted in GENIE 1.0 and HUGIN (Figure 2), the header cells indicate parent states and the numerical cells display the conditional probability distributions. The parent states are orga nized in a hierarchical structure that labels the condi tional probability distributions. A table is a natural view for multi-dimensional data and, when it fits on the screen, it is fairly easy to explore. However, when a table is larger than the available screen area (this happens very often given the exponential growth of CPTs), users have to scroll back and forth to locate a particular conditional probability distribution. Watts (1994) observed that users of very large spreadsheets were often lost and ended up creating paper maps to guide them in navigation.
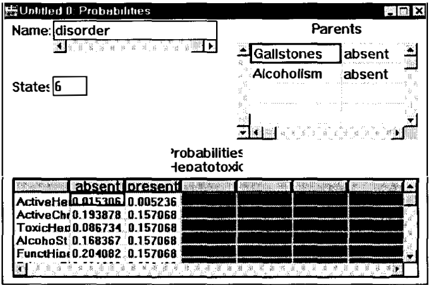
Another approach is using a list, a solution applied in NETICA (Figure 3). NETICA's navigation screen consists of a list of all possible combinations of parent states. The list of conditional probability distributions associated with each parent combination is shown next to the list of parent outcomes. Both lists are viewed by scrolling. If there are more items than those which can be shown in a list view, a scroll bar is provided for users to look for the hidden items. In Figure 3, two parents of node Disorder are shown in the parent list. The third one is hidden. The list in NETICA can be viewed as a transposed matrix of the table in GENIE and HuGIN. But the hierarchical structure is not clear in the list. Users are required to manually traverse the hierarchy to determine its structure. Generally, lists are capable of providing detailed content information but are poor at presenting structural information. A great deal of effort is needed on the part of the user to achieve a mental model of the structure in large hierarchies.
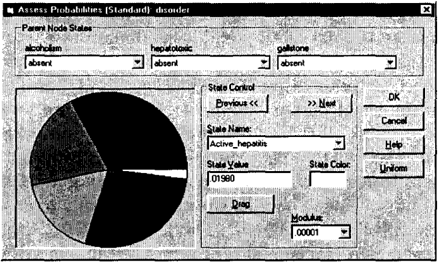
Yet another solution is based on combo boxes, applied in MSBN (Figure 4). There is one combo box for each parent and it is used to select an outcome for that parent. Only one column of the CPT is visible at a time. In order to select a column, the expert has to assign values to all of the parents manually. When there are many parents, there is a danger that the user will forget to assign some of these combinations and, effectively, leave some of the probabilities unspecified.
Separate tables for parent combinations and condi tional probabilities are yet another solution. ERGO uses two separate tables, one for a parent list and the other for a probability editor (Figure 5). When editing conditional probabilities for a node, the last parent is displayed in the probability editor table, and all other parents are displayed in the parent list. Separate ta bles show the conditional probability distribution for one combination of values of parents at a time, oc-
cupying relatively small screen space. However, it is important to recognize that shifts from one table to another can be cognitively costly (Woods 1984).
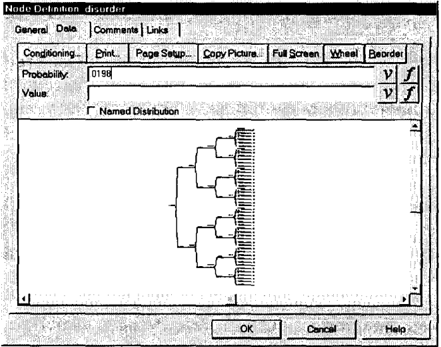
A probability tree is a natural and familiar metaphor for the organization of conditional probability informa tion. DPL provides a probability tree showing all of the possible combinations of parent outcomes (Figure 6). In DPL, the tree is always completely expanded and the entire tree appears in the available display space. The program shrinks the tree as needed to fit it on the screen. There is no zooming function for a clear view. The tree view provides a visual hierarchy of the context for specification of conditional probabilities. However, a completely expanded tree in a restricted display space becomes quickly unreadable. It is al most impossible to navigate in the tree view without remembering the order of parents and their outcomes.
3.2 ELICITATION OF PROBABILITIES
Probability wheel (Spetzler & Stael von Hostein 1975; Merkhofer 1987) is probably the oldest and the most
popular graphical tool for probability elicitation. It consists of a wheel with two adjustable sectors (tradi tionally colored red and blue) and a fixed pointer in the center. When spun, the wheel will finally stop with the pointer either in red or blue sector. The probability that the wheel will stop in the red sector is propor tional to the sector size. The relative size of the two sectors can be adjusted until the expert judges that the event under consideration is equally likely as the event of the wheel stopping in the red region. In computer systems (e.g., DATA, DPL and MSBN), it is usually im plemented as a pie chart. The pie chart is partitioned into several sectors representing each of the outcomes of the variable. The area of each sector is proportional to the probability of the corresponding outcome. The user can shrink or expand the proportion of each area by dragging its edge to the desired position.
While the probability wheel is a useful tool, it has several disadvantages. Probability elicitation involves complex perceptual processes that include judgements of proportions, comparisons, and changes. Graphi cal tools help experts to estimate proportions, and to dynamically change the sizes of component parts in the graph until the sizes reflect personal beliefs of the experts. When eliciting subjective probabil ities, some experts find it difficult to judge a part to-whole proportion. They often use a larger value as reference point and compare smaller values with it for a part-to-part judgement. Although empirical studies have demonstrated that pie charts lead to a higher accuracy in part-to-whole judgement of propor tion, they have shown inferiority of pie charts to bar graphs in part-to-part comparison and change percep tion (Cleveland & McGill 1984; Simkin & Hastie 1987; Hollands & Spence 1992; 1998). A pie chart has the ad ditional disadvantage of being too fragmentary when
partitioned into many sectors. Preece et al. (1994) rec ommended that a pie chart should be used only when there are fewer than five sectors.
Lack of user control is another problem with the exist ing implementations of probability wheel. Since total probability is always equal to one, a specific change in probability of one outcome results in proportional changes in the probability of the remaining outcomes. The proportion of the remaining outcomes usually stays the same. However, this automatic adjustment of probabilities is frustrating when an expert just wants to modify some of the numbers and keep other num bers unchanged. This happens, for example, when the expert accepts some probabilities encoded and only wants to graphically modify remaining probabilities. It seems necessary to let the expert be in control of when and to which probabilities the automatic changes apply.
Besides, the legend annotation of a pie chart requires a mapping procedure to recognize which sector rep resents which outcome of the variable. When a vari able has many outcomes, it becomes difficult for the user to search in a long list for those mappings be tween outcomes and sectors. The coordination of hu man focal attention and orienting perceptual functions such as peripheral vision supports the process of know ing where to look, and when (Rabbitt 1984). Woods [1984] suggested the use of a center-surround tech nique, which is an annotation style that labels wedges around sectors of the pie. A direct label is provided for each sector, thus reducing the mental workload of the users.
4 GRAPHICAL TOOLS DEVELOPED
In this section, we describe the graphical tools that we have developed for the purpose of elicitation of prob abilities in conditional probability tables (CPTs).
4.1 NAVIGATION IN CPT'S
As we discussed in the previous section, the plain form of a CPT is hard to navigate due to the exponential growth of its size. In order to address this problem, we adopted the tree metaphor for hierarchical visual representations and developed two browsing tools: the CPTREE (conditional probability tree) and the sCPT (shrinkable conditional probability table).
4.1.1 Conditional Probability Tree
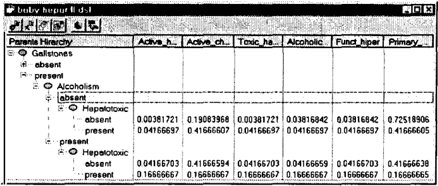
The CPTREE (Figure 7) is a tree view of a node's CPT. In a CPTREE, every parent variable is repre- sented by two levels of nodes, the name level and the outcome level. The name level is comprised of a sin gle node indicating the variable's name. The outcome level includes nodes for all possible outcomes of the corresponding variable. The name node always ap pears as the parent of the outcome nodes for the same variable. Each name node is a child of an outcome node of the previous parent variable. The root of the CPTREE is the name node of the first parent variable. The path from root to a leaf specifies a combination assignment to values of parents. On the right-hand side of the tree is a table in which each row is asso ciated with a branch in the tree. The table defines the probabilities conditional on the context specified by the branches.
With shrinking and expanding function, an expert can quickly go to the branches of interest while collaps ing others in order to optimize screen use. A click on the corresponding toolbar icon will bring up a prob ability wheel for the probability distribution condi tioned on the selected combinations of the parent as signments for the current node represented by the CP TREE. A combination of parent assignments is spec ified by a path from the root to a leaf in the CP TREE. If a leaf node is selected, the conditioning con text is given by all of the parent assignments along the path. If an internal node in the CPTREE is se lected, the context is given by a partial combination of parent assignments. Only those parents that are between the root of the tree and the selected node will count. For example, in Figure 7, when the tree node absent under Alcoholism is selected, the selected branch specifies the context of Gallstones = present 1\ Alcoholism = absent. The state of Hepatotoxic is ir relevant. In other words, the probability distribution over Disorder is independent of the state of Hepato toxic. The selected branch defines a context-specific independence (also called asymmetric independence) relationship (Shimony 1993; Boutilier et al. 1996; Geiger & Beckerman 1996) between the current vari able, Disorder, and its parent, Hepatotoxic medica tions.
Our design of the navigation interface allows the user
to dynamically change the order of the parents in the navigation windows. Many times the users of GENIE 1.0 found the order of node parents counterintuitive because it did not follow the temporal or causal or der. Changing the order of parents as the user desires allows the user to compose the most natural order of conditioning events. Secondly, it facilitates easy en coding of context-specific independence.
Multiple selection of branches is also supported. By selecting multiple branches and then triggering graph ical elicitation through the probability wheel, experts can give their assessment for those conditional prob abilities that are numerically identical but different in conditions. In Figure 7, the conditional probabil ities under the context of Gallstones = present 1\ Alcoholism = absent 1\ Hepatotoxic = present, and the conditional probabilities under the context of Gallstones = present 1\ Alcoholism = present 1\ Hepatotoxic = absent can be estimated at the same time by selecting both of the corresponding branches. Using this multiple assignment, experts can save a lot of duplicate input, which often happens in flat CPTs of current graphical probabilistic modeling development environments.
4.1.2 Shrinkable Conditional Probability Table
The sCPT (Figure 8) includes virtually all of the func tions implemented in the CPTREE. Double-clicking on a header item triggers the shrinking or expand ing of the columns that it covers. We can view the sCPT as a tree-structured conditional probability ta ble. All the columns in the covered range of a header item constitute its children items. A branch can be traced from the first header row through its covered range. With the aid of probability tools, experts can assign the same probability values to multiple groups under distinct branches.
Compared to the CPTREE, the sCPT has a higher data density, which is a desired property of graphical displays of quantitative data, defined as the ratio of the amount of data displayed to the area of the graphic
(Tufte 1998). In the CPTREE, a considerable amount of screen area is consumed at the expense of display ing the dependence context for conditional probabili ties. This results in the difficulty of the CPTREE to represent a node with a large number of parents. How ever, for some users, the CPTREE may visualize the structure of conditional dependence more intuitively.
4.2 PROBABILITY ASSESSMENT TOOLS
We have designed a graphical tool for elicitation of discrete probability distributions that implements two chart styles: pie charts and bar graphs. When the user selects the assessment tool within the navigation window, the tool is presented in a separate pane of the splitter window of the navigation tool.
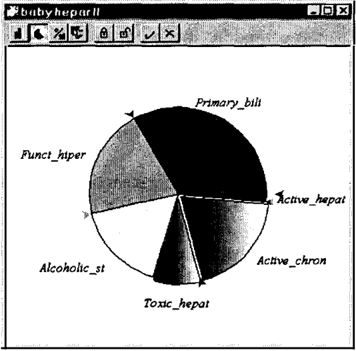
Our pie chart (Figure 9) combines easy user interac tion with intuitive illustration. To change a proba bility of an outcome of a variable, the user drags the handle of the corresponding sector in the pie to its new position. During the dragging process, the pie is redrawn, showing the new partition resulting from the probability changes. When one probability is be ing changed, the remaining probabilities are automati cally adjusted proportionally. If the user wants to keep the probabilities of some events intact, she can simply click the right mouse button on the sectors correspond ing to these events to lock them before beginning the dragging process. A right click on a locked sector un locks it. A locked sector of the pie is shaded out and drawn slightly outside the pie, visually communicat ing the idea that this part of pie is cut off and cannot be changed. In Figure 9, two outcomes of Disorder: Toxic_hepat and Active_chron are locked and shaded out of the whole pie.
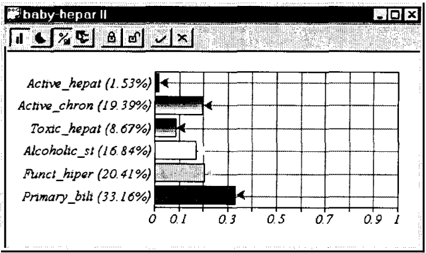
Our bar graph (Figure 10) provides a similar func tionality. The user can adjust the length of a bar by dragging the handle at its end horizontally to a new position. The unlocked bars are changed proportion ally, while the locked bars remain unchanged during the adjusting process. All locked bars are shaded in their vertical color gradients. Figure 10 shows a proba bility elicitation tool styled as a bar graph with prob ability scale appearing on the bottom of the graph. Toxic_hepat and Active_chron are locked and shown in their vertical color gradients.
We provided two labeling options for both chart styles. One is simple text of the outcome name as shown in Figure 9. The other is the name plus its probability as shown in Figure 10. Text labeling eliminates the inter ference of numbers and leads to a qualitative estima tion from experts. Percentage labeling allows experts to see the exact numerical parameters corresponding to the manipulated graph components.
In addition, we use center-surround labels for the pie chart. Labels are positioned outside the pie near their corresponding sectors. This supports the user's per ceptual process of knowing where to look and when, and reduces the mental workload of mapping labels from legend annotation to the corresponding sectors in the pie. When there are overlaps for two adjacent labels, only the last one is displayed, the next label is hidden.
Both charts are viable alternatives for probability elic itation tools, although they serve different purposes. Pie charts are more natural to show the relative dis tribution of data among sectors that make up a whole. Generally they support more accurate assessment of part-to-whole proportion. But our bar graphs are sup plemented with a scale ranging from zero to one, which also facilitates assessment of part-to-whole proportion. On the other hand, people sometimes do not have a clear idea about what proportion a part takes up in a whole. But they often can give a proportion of one part to another by comparing them. According to the ranking of human perception identified by Cleveland and McGill (1984), people usually produce faster and more accurate judgements when comparing position and length than when comparing angle or area. In ad dition, bar graph has an advantage over pie chart in the perception of change. People can easily capture small changes in a bar graph. Thus, a bar graph can be expected to allow for a better performance in prob ability estimation based on part-to-part proportion.
5 IMPLEMENTATION AND EMPIRICAL VERIFICATION
We have implemented the tools described in this pa per in a forthcoming GENIE 2.0, an environment for building graphical decision-theoretic models, under de velopment at the Decision Systems Laboratory, Uni versity of Pittsburgh. User interface has received a considerable attention in GENIE. We believe that GENIE's growing popularity (over 2,200 users of GE NIE 1.0 as of May 2000) can be in part attributed to our attention to detail and the resulting powerful, yet pleasant interface. One of our objectives is to enhance GENIE's interface so that it becomes natural and easy to use for both experts and novices. We believe that it is not the speed of inference but rather the quality of the user interface that will increase the popularity of decision-theoretic methods. In our experience, reason ing in most practical models is sufficiently fast. The current bottleneck is in building models. Therefore, techniques that facilitate model building and intuitive interaction with the system are worth pursuing, even if they are cumbersome to implement in software.
All GENIE 2.0 windows are fully resizable. Users can always see a larger view of a CPTREE or a probabil ity wheel by enlarging an appropriate window. The size of the pie chart or bar graph is adjusted automat ically to fit in the newly resized window. A relevant detail of our implementation is that GENIE's models are always syntactically correct at any stage of model development. A newly added node, in particular, has by default two outcomes, StateD and Statel, that are uniformly distributed. Any additional operation pre serves this correctness. A negative side-effect of this is that the program does not have a clear way of showing which probabilities have been elicited and which have not.
While there have been other studies testing graphi cal representation of numerical data (e.g., Feldman Stewart et al., 2000; Sparrow, 1989), none of them fo cused on elicitation of probabilities. We tested empiri-
cally the two graphical probability elicitation methods, pie chart and bar graph, on a task involving elicitation of conditional probability distributions (Wang, Dash, & Druzdzel 2000). The results of our test have shown statistically significant differences in both speed and accuracy between each of the two methods and direct elicitation of numerical probabilities. Even though graphical probability elicitation methods were both faster than direct elicitation of numerical probabilities, bar graph was a clear winner in terms of both accuracy and speed ( 11% more accurate and 41% faster than di rect elicitation and 3% more accurate and 35% faster than the pie chart). Space constraint does not allow us to report the details of that study in the current paper.
Qualitative questionnaire conducted at the conclusion of the study has shown that our subject valued highly the availability of navigational tools and in majority of cases preferred graphical elicitation to direct numerical input of probabilities (there were some exceptions). As far as preference between the two graphical modes is concerned, we noticed that it varied between subjects, suggesting that a good tool should provide a variety of methods that can adjust to individual user preferences.
6 CONCLUDING REMARKS
The tools proposed in this paper enhance greatly user navigation in CPTs during the process of model build ing and help to improve both the quality and speed of elicitation. Also, the flexible navigation and visual ization of probability distributions help to detect un specified probabilities and inconsistency in responses. Combined, these tools provide a pleasant and power ful visual environment in which experts can give their qualitative estimates of numerical probabilities.
While the tools that we have designed and imple mented may be applicable to other graphical proba bilistic structures, such as chain graphs, we focused on Bayesian networks. Obviously, the methods are also applicable to chance nodes in influence diagrams (Howard & Matheson 1984). We plan extending these tools to utility nodes and chance nodes described by canonical probabilistic interactions, such as Noisy-OR or Noisy-AND nodes. A useful enhancement to the bar graph tool will be marking it with user-defined proba bility scales, such as verbal probabilities, that will for some users enhance the elicitation process even fur ther.
We did not use 3-D displays, even though extra di mensions are often decorative and attractive. Some experiments (Spence 1990; Carswell, Frankenberger, & Bernhard 1991; Siegrist 1996) evaluated 3-D graphs in a perception task of relative magnitude estimation.
The results did not show an advantage of 3-D displays in accuracy and speed. The performance of 3-D dis plays depends on the graphs and tasks. Compared to their 2-D counterparts on relative magnitude estima tion, 3-D pie charts result in lower accuracy, and the 3-D bar graphs require a longer elicitation time.
One limitation of the current version of the assessment tools is lack of support for elicitation of very small probabilities. Due to the screen resolution restriction and sensitivity of mouse movement, it is hard to cap ture very small changes of mouse position. There fore, it is impossible to distinguish between low prob abilities such as 0.000001 and 0.00001, even though they are orders of magnitude apart. Such values have to be entered manually. Using longer bars or big ger pies can improve the assessment accuracy of very low probabilities, but this consumes more screen re sources. A good solution applied by others is the log scale (Lopez Gomez 1990).
Acknowledgments
The research was supported by the Air Force Office of Scientific Research grants F49620-97-1-0225 and F49620-00-1-0112 and by the National Science Foun dation Faculty Early Career Development (CAREER) grant IRI-9624629. While we are sorely responsible for any errors in the paper, we would like to thank Javier Diez and anonymous reviewers for valuable feedback. We are grateful to Michael Lewis and Stephen Hir tle for their guidance through the Human-Computer Interaction literature and valuable suggestions. Our colleagues in the Decision Systems Laboratory con tributed to the design of the tools described in this paper with their suggestions.
References
Boutilier, C.; Friedman, N.; Goldszmidt, M.; and Koller, D. 1996. Context-specific independence in Bayesian networks. In Proceedings of the Twelfth An nual Conference on Uncertainty in Artificial Intelli gence (UAI-96), 115-123. San Francisco, CA: Mor gan Kaufmann Publishers.
Carswell, C. M.; Frankenberger, S.; and Bernhard, D. 1991. Graphing in depth: perspectives on the use of three-dimensional graphs to represent lower dimensional data. Behavior f3 Information Technol ogy 10:459-474.
Cleveland, W., and McGill, R. 1984. Graphical per ception: Theory, experimentation, and application to the development of graphical methods. Journal of the American Statistical Association 79:531-554.
Druzdzel, M. J., and van der Gaag, L. C. 1995. Elici tation of probabilities for belief networks: Combining qualitative and quantitative information. In Proceed ings of the Eleventh Annual Conference on Uncer tainty in Artificial Intelligence (UAI-95 ) , 141-148. San Francisco, CA: Morgan Kaufmann Publishers, Inc.
Feldman-Stewart, D.; Kocovski, N.; McConnell, B. A.; Brundage, M. D.; and Mackillop, W. J. 2000. Perception of quantitative information for treatment decisions. Medical Decision Making 20:228-238.
Geiger, D., and Heckerman, D. 1996. Knowledge representation and inference in similarity networks and Bayesian multinets. Artificial Intelligence 82:4574.
Heckerman, D.; Horvitz, E.; and Nathwani, B. 1992. Toward normative expert systems: Part I. the Pathfinder project. Methods of Information in Medicine 31:90-105.
Henrion, M. 1989. Some practical issues in con structing belief networks. In Kana!, L.; Levitt, T.; and Lemmer, J., eds., Uncertainty in Artificial Intel ligence 3. North Holland: Elsevier Science Publishers B.V. 161-173.
Hollands, J., and Spence, I. 1992. Judgements of change and proportion in graphical perception. Hu man Factors 34:313-334.
Hollands, J ., and Spence, I. 1998. Judging propor tion with graphs: The summation model. Applied Cognitive Psychology 12:173-190.
Howard, R. A., and Matheson, J. E. 1984. Influ ence diagrams. In Howard, R. A., and Matheson, J. E., eds., The Principles and Applications of Deci sion Analysis. Menlo Park, CA: Strategic Decisions Group. 719-762.
Kahneman, D.; Slavic, P.; and Tversky, A., eds. 1982. Judgment Under Uncertainty: Heuristics and Biases. Cambridge: Cambridge University Press.
Lopez Gomez, U. A. 1990. Communicating very Low Probability Events. Ph.D. Dissertation, Department of Engineering and Public Policy, Carnegie Mellon University, Pittsburgh, PA.
Merkhofer, M. W. 1987. Quantifying judgmental uncertainty: Methodology, experiences, and insights. IEEE Transactions on Systems, Man, amd Cybernet ics SMC-17(5):741-752.
Onisko, A.; Druzdzel, M. J.; and Wasyluk, H. 1998. A probabilistic causal model for diagnosis of liver dis orders. In Proceedings of the Seventh International Symposium on Intelligent Information Systems (IIS98), 379-387.
Pearl, J. 1988. Probabilistic Reasoning in Intelligent Systems: Networks of Plausible Inference. San Ma teo, CA: Morgan Kaufmann Publishers, Inc.
Preece, J.; Sharp, H.; Benyon, D.; Holland, S.; and Carey, T. 1994. Human-Computer Interaction. New York: Addison-Wesley.
Rabbitt, P. 1984. The control of attention in visual search. In Parasuvaman, R., and Davis, D., eds., Varieties of Attention. New York: Academic Press.
Shimony, S. E. 1993. The role of relevance in explana tion I: Irrelevance as statistical independence. Inter national Journal of Approximate Reasoning 8(4):281324.
Siegrist, M. 1996. The use or misuse of three dimensional graphs to represent lower-dimensional data. Behavior f3 Information Technology 15(2):96100.
Simkin, D., and Hastie, R. 1987. An information processing analysis of graph perception. Journal of the American Statistical Association 82:454-465.
Sparrow, J. A. 1989. Graphical displays in informa tion systems: Some data properties influencing the effectiveness of alternative forms. Behaviour f3 In formation Technology 8(1):43-56.
Spence, I. 1990. Visual psychophysics of simple graphical elements. Journal of Experimental Psychol ogy: Human Perception and Performance 16:683692.
Spetzler, C., and Stael von Hostein, C.-A. 1975. Probability encoding in decision analysis. Manage ment Science 22:340-358.
Tufte, E. R. 1998. The Visual Display of Quantitative Information. Cheshire, Connecticut: Graphics Press, 16th edition.
Wang, H.; Dash, D.; and Druzdzel, M. J. 2000. Datamining expert beliefs: A method for evaluating Bayesian network elicitation schemes. Under review.
Watts, J. 1994. Navigation in the computer medium: A cognitive analysis. In Proceedings of the Human Factors and Ergonomics Society, 38th Annual Meet ing. Santa Monica, CA: Human Factors and Er gonomics Society.
Woods, D. 1984. A concept to improve the cogni tive coupling of person and computer. International Journal of Man-Machine Studies 21:229-244.