Contents
1302.3582
Why is diagnosis using belief networks insensitive to imprecision in probabilities?
Max Henrion, Malcolm Pradhan t , Brendan Del Favero * , Kurt Huang t , Gregory Provan, Paul O'Rorke *
The Decision Laboratory Institute for Decision Systems Research 4984 El Cam i n o Real, Suite 110 Los Altos, CA 94022
Abstract
Recent research has found that diagnostic perfor mance with Bayesian belief networks is often surprisingly insensitive to imprecision in the numerical probabilities. For example, the authors have recently completed an extensive study in which they applied random noise to the numeri cal probabilities in a set of belief networks for medical diagnosis, subsets of the CPCS network, a subset of the QMR (Quick Medical Reference) focused on liver and bile diseases. The diagnostic performance in terms of the average probabilities assigned to the actual diseases showed small sen sitivity even to large amounts of noise. In this paper, we summarize the findings of this study and discuss possible explanations of this low sen sitivity. One reason is that the criterion for perfor mance is average probability of the true hypotheses, rather than average error in probabil ity, which is insensitive to symmetric noise distri butions. But, we show that even asymmetric, logodds-normal noise has modest effects. A sec ond reason is that the gold-standard posterior p ro ba biliti es are often near zero or one, and are little disturbed by noise.
1 INTRODUCTION
Many researchers have criticized the use of probabilistic representations in general, and belief networks in particu lar, because of the need to provide many numbers to spec ify the conditional probability distributions. These numbers may be judged directly by experts in the domain of interest, or t h e y may be obtained by fitting a belief net work to a set of observed cases. In either case, they are liable to imprecision, due to the difficulty people have in expressing their beliefs numerically. or due to the finite amounts of case data available for estimation. If very pre cise numbers are needed, these criticisms would have con siderable bite. If rough approximations are adequate, then they may lose their sting.
t also Section on Medical Informatics, Stanford University, Stanford, CA 94305.
* also Engineering-Economic Systems, Stanford Univer sity, Stanford, CA 94305.
*The Cognition Institute, University of West Florida, Pensacola, FL 32514.
In recent research, we have explored empirically the ques tion of how precise these probabilities need to be to obtain adequate performance from the belief network for diag nostic inference. Overall, we have been surprised at the degree of robustness of belief networks that we have found to imprecision in the probabilities. The primary goal of this paper is to explore possible reasons for this robustness so that we can better understand how it arises, when we can rely on it, and when we cannot. By better understand ing how the diagnostic performance is affected by error or uncertainty in the probabilities, we can discover how pre cisely we need to estimate the probabilities, and hence whether or when belief networks can be practical and reli able.
2 FINDINGS OF ROBUSTNESS
Our investigation was based on a series of real-world Bayesian belief networks (BNs), rather than on the ran domly generated, abstract knowledge bases (KBs) used in much of the experimental research to compare knowledge representations. Although it is easy to generate BNs with a wide range of different characteristics - such as ratio of arcs to nodes, ratio of source nodes to internal nodes, or frequency of directed cycles- we wanted to focus on BNs that have the characteristics of real application domains. We believe such BNs are more likely to be rele vant to other real application domains than artificially-gen erated networks. The problem domain that we use in this study is medical diagnosis for hepatobiliary disorders (liver and bile diseases).
Numerical probabilities for belief networks may be esti mated from e mp i rical data or assessed b y experts. In either case, the numbers are subject to various sources of inaccu racy and bias. For example, the data may be obtained from a sample that is not truly representative of the application domain, or the expert may have nonrepresentative experi ence. Limited sample sizes lead to random error. The pro cess of expert assessment of probabilities is subject to a variety of inaccuracies which have been the subject of extensive study. [Kahneman, et al.1982] The question we wish to address here is how far t h es e sources of impreci sion are likely to matter.
We performed experiments to examine the sensitivity of BNs to the expert probabilities. In the experiments, we assessed the effects of random noise in the numerical probabilities on diagnostic performance, measured as the
probability assigned to the correct diagnosis averaged over a large number of diagnostic test cases, for three different BNs. We added random noise to the probabilities derived from the standard, empirically derived mapping [Hecker man and Miller 1986] from frequency weights into proba bilities. We added noise separately to the link probabilities, leak probabilities, and the prior probabili ties. By examining the effect of noise separately on each of these three types of probability, we were able to differ entiate among them in terms of their effect on diagnostic performance.
2.1 EXPERIMENTAL NETWORKS
We derived the experimental BNs from an early quasi probabilistic KB, the Computer-based Patient Case Simu lation (CPCS) [Parker and Miller 1987)]. CPCS uses a re pr e s enta t i o n derived from the InternistI [Miller, et a!. 1982] and Quick Medical Reference (QMR) [Miller, et al. 1986] expert systems. In these knowledge bases, causal links, such as relationships between diseases and findings are quantified as frequency weights, specifying the chance that one diseases will give rise to a finding or other vari able, on a five-point qualitative scale. In previous work, our group developed a method to convert from the Inter nist-! /QMR representation to a belief network representa tion, with specific independence assumptions conditional independence of findings given diseases, noisy-OR influences of diseases on findings, and marginal independence of diseases [Shwe, et a!. 1991J. Empirical comparison of QMR with the probabilistic reformulation, QMR-BN, demonstrated comparable diagnostic perfor mance [Middleton, et al. 1991], even though some infor mation (e.g. linkages between diseases) was not employed inQMR-BN.
Our first task in the current work was to convert the CPCS knowledge base into a coh e r e n t BN, mapping frequency weights into link probabilities, which are the conditional probabilities of each finding given each disease. We also had to assess additional leak probabilities, to quantify the chance that each find i n g , or other variable, will b e present but not caused by one of the diseases or other variable in the knowledge base, and prior probabilities to quantify the prevalence rate of each disease or predisposing factor.
Because CPCS-BN is large and multiply-connected, it is impractical to perform inference with available inference algorithms using the entire network. If we wish to com pute only the posterior p r ob a bi l i t i es of a small set of dis eases, we can perform inference using only the subnetwork of the CPCS network that is relevant. We selected subnetworks from the full CPCS-BN using the BN graphical tool Netview [Pradhan, et al,l994]. N e t vi e w allows the user to display selected subsets of nodes from a network for simplicity of visualization and editing.
We extracted three subnetworks from the full CPCS-BN for the experiments, named BN2, BN3, and BN4, contain ing two, three, and four diseases. W hile CPCS has 365 nodes, BN2, BN3, and BN4 contain 42, 146, and 245 nodes, respectively.
2.2 'lEST CASES
We needed far more test cases to estimate reliably the effects of the experimental manipulations on the diagnos tic performance than the small number of cases available from real patient data. Accordingly, we generated sample test cases directly from the BNs themselves, generating findings according to the probabilities specified by the net work using logic sampling [Henrion 1988]. We used the full CPCS network and the standard probability mapping for generating the test cases.
Since we wanted to investigate how the amount of evi dence affects sensitivity to the experimental manipula tions, we generated cases with varying numbers of findings. The test cases, as initially generated, include val ues for all findings. To create harder cases with fewer find ings, and also for greater medical realism, we created five cases from each initial case, by revealing the findings in five Phases, approximating the order in which findings would be revealed in a real medical consultation. The five Phases c o rr es p o n d to successive stages in medical diagno sis. Phase 1 includes symptoms and findings volunteered by the patient- e.g., abdominal pain in the epigastrium. Phase 5 includes all previous phases plus expensive, inva sive laboratory tests, including pathology findings, which are usually obtained through biopsies- e.g., hepatocellu lar inflammation and/or necrosis.
2.3 MEASURES OF DIAGNOSTIC PERFOR MANCE
We quantify diagnostic performance as the probability assigned by each network to each true diagnosis, averaged over the set of test cases. We analyze separately the proba bilities assigned to each disease when present (we call this the true positive rate), and the probability assigned to the absence of each disease when absent (we call this the true negative rate).
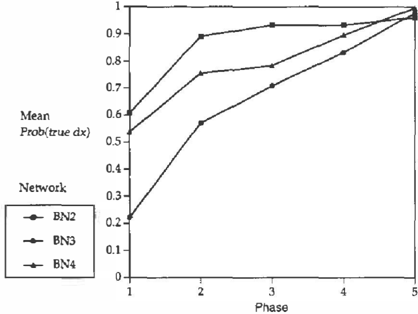
Figure 1 plots the average probability assigned to the true diagnosis (true positive and true negative) as a function of
the Phase for each of the three networks. As expected, diagnostic performance improves consistently with Phase -that is, the additional findings available in the later Phases lead to a higher average posterior probability of the true diagnosis. Performance starts out relatively poorly for Phase 1, especially for BN3, where the average posterior probability for the true diagnosis is 0.22. But, with with the entire set of evidence available in Phase 5, diagnostic performance becomes excellent, averaging 0.978 over the three networks.
2.4 LOG-ODDS NORMAL NOISE
Perhaps the most obvious way to add noise to a probability is to add a random noise directly to the probability. This approach has two problems. First, a large additive error is likely to produce a probability greater than 1 or less than 0, and so needs to be truncated. Second, an error of plus or minus 0.1 seems a lot more serious in a probability of 0.1, ranging from 0 to 0.2, than it does in a probability of 0.5, ranging from 0.4 to 0.6. Link probabilities near 0 or l can have enormous effects in diagnosis for findings that are present or absent (respectively).
A more appealing approach that avoids these problems is to add noise to the log-odds rather than the probability. This approach can be viewed as a version of Fechner's law of psychophysics in which similar just-noticeable differ ences in quantities such as weight or brightness are approximately constant when measured on a logarithmic scale. Since probability has two bounds, 0 and 1, we wish to have a symmetric effect near each bound. The log-odds transformation provides exactly this behavior.
More specifically, we transformed each probability pinto log-odds form, added normal noise with a standard devia tion of cr and transform back into probabilities. We define the log-odds transformation as:
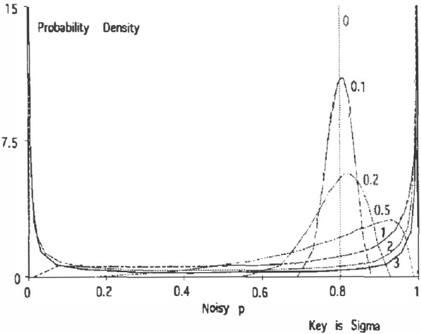
Note that the amount of noise implied by Figure l is very substantiaL Figure 2 shows second-order probability den sity functions for logodds-normal probability distributions for sigma 0.1, 0.2, 0. 5 , 1, 2, and 3. For cr :5 0.5, the density function is unimodal. For cr � 1, the density function becomes bimodal with peaks at zero and one. In other words, for cr values of 1 or more, the noise is so extreme that most of the probabilities are near zero or one, rather than near the gold-standard probability. The logodds-nor mal distribution guarantees only that the median probabil ity is equal to the gold-standard. The mean probability may be very different.
2.5 EXPERIMENTAL DESIGN
We start with binary networks using the standard mapping with no noise ( cr = 0), and then add noise, generated inde pendently for each link probability in the network, with cr = 1.0, cr = 2.0, and cr::::: 3.0. We generated 10 noisy net works independently for each cr. Similarly, we created noisy networks adding noise only to the leak probabilities, and only to the prior probabilities for each network.
The total number of networks used in this experiment were 273, comprised of 3 levels of noise X 3 probability types (link, leak, and priors) X lO samples X 3 networks, plus the original 3 standard networks without noise. For each of these networks, we ran the entire set of cases, requiring a total of291,200 runs. We assessed performance using the average probability assigned to the true diagnoses.
2.6 RESULTS
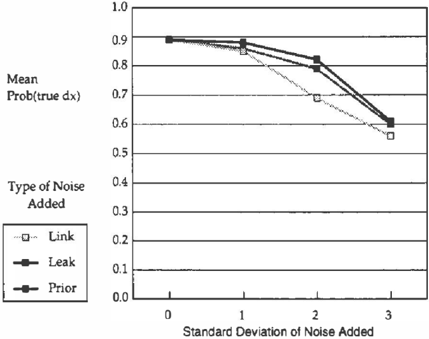
Figure 3 plots the average performance -the probability assigned to the true diagnosis-for the four-disease net work against the four levels of noise on the link, leak, and prior probabilities. Plots for the two-disease and three-dis ease networks are similar. We see that, as expected, increasing noise consistently degrades performance for each type of probability -link, leak, and prior. Perfor mance is relatively more sensitive to noise on links than to noise on priors or leaks. The effect of noise on the leaks and priors is indistinguishable for networks BN3 and BN4.
The introduction of noise in the numerical probabilities does degrade performance, as expected. However, the amount of degradation is surprisingly small when one con siders the degree of noise. It appears that even large errors in the probabilities produces only modest degradations in performance
Standard Deviabon of Noise Added
Figure 3. Effects of noise in the link, leak, and prior prob abilities on average diagnostic perfonnance for the BN4 network.
2.7 EFFECTS OF NOISE ON TRUE POSITIVES AND NEGATIVES
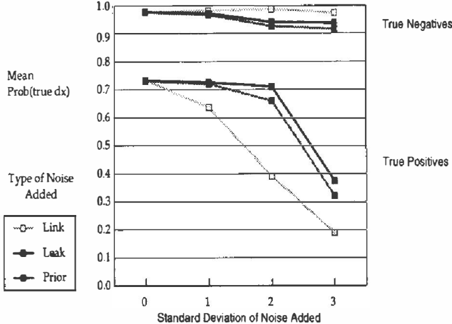
Hitherto, our analysis has combined the probabilities assigned to true positives (TP)i.e., the probability of the disease for cases in which the disease is present, and probabilities assigned to true negatives (TN)- i.e., the probability of no disease for cases in which the disease is absent. We can obtain interesting insights that help explain our results by examining the effects of noise on these two measures separately. Figure 3 plots the average probability assigned to the true diagnosis separately for TP and TN, as a function of the noise level in the link, leak, and prior probabilities. These results were similar for each of the three networks. Accordingly, for simplicity, Figure 3 shows results averaged over the three networks.
The first point to note is that, without noise, the average
perfonnance for true negatives (TN) at 0.97 is substan tially better than for true positives (TP) at 0.73. In other words, the system is more likely to miss a disease that is present than to falsely diagnose a disease that is not present. This tendency to underdiagnose should be expected because the prevalence of diseases in the test cases is much larger than would be expected according to the prior probabilities on the diseases. Note that we delib erately generated most of the test cases to contain one or more diseases to provide more information on diagnostic perfonnance on interesting cases, even though according to the priors, more cases would have no diseases.
Now let us look at the effect of noise levels on TP and TN . Noise in the link probabilities significantly degrades per formance for TP, but has no statistically detectable effect on TN (a.= 0.05). Conversely, noise in the leak probabili ties has no statistically detectable effect on TP at noise lev els cr= 1 and cr = 2, but leak noise significantly degrades TN. Finally, noise in the priors has a similar, slight, but significant, effect in degrading performance on both TP and TN. At the highest noise setting, cr = 3, the perfor mance of networks with leak noise and prior noise sharply decline because the disruption to the probability values is so extreme (Figure 2).
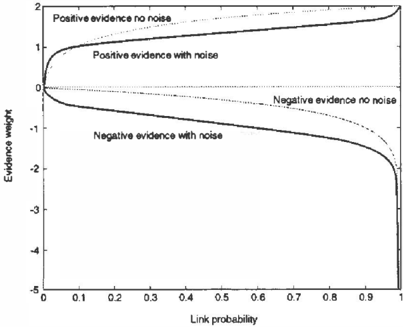
Why should link noise and leak noise show these contrary effects on TP and TN? We can explain these results by analyzing the role of the link and leak probabilities in the diagnosis. For simplicity, let us consider the effect of a sin gle finding F, being present, f, or absent, -f, on the poste rior odds of a single disease D. A standard measure of the strength of diagnostic evidence is the log-likelihood ratio, also known as the evidence weight:
P(j I d), the probability of the finding when the disease is present is:
P(j\-d), the probability of the finding when the disease is absent, is the leak probability, Leak(F). We can now rewrite the likelihoods in terms of the link and leak proba bilities.
Notice the leak probability does not play a role in t h e neg ative evidence weight (Eq. 4), because if a finding is absent then the leak must be 'off by definition.
Figure 5 plots the evidence weights for positive and nega tive findings, as a function of the link probability, and the mean evidence weight with 2 sigma noise in the link prob ability. It demonstrates that, on the average, noise in the link decreases the evidence weight for the finding. This effect arises from the fact that the evidence weights are concave functions of the link probability. Accordingly, the noise in the links will tend to reduce the probability assigned to the true positive, reducing performance as noise increases. Noise in the links, by reducing the eviden tial strength of findings can only increase the probability assigned to true negative, but this effect is undetectable because the true negative rate is already high.
The impact of noise on the positive evidence (Eq. 3) is bounded by the value of the leak. The smaller the leak, the greater the possible effect on the positive evidence. In con trast, the negative evidence weight (Eq. 4) can be signifi cantly decreased if the link probability is close to 1.0, as is the case with sensitive findings.
A related argument demonstrates that noise in leak proba bilities will tend to increase the strength of evidence on the average. In consequence, noise in leaks also tends to increase false positives and so degrades performance for true negatives. The effect on true positives is again not detectable.
3 WHY SYMMETRIC UNCERTAINTY IN PROBABILITY DOES NOT MAT TER
One reason that we may find these findings of robustness surprising may be due to a mi s a ppr eh e n s io n of the nature of uncertainty about probability. Random noise in proba bility tends to be much less important than random noise in other quantities of interest, because, when averaged over many cases, we should care only about the average or expected probability. This is reflected in the scoring rule that we used in our study, the average probability assigned to the disease that is present, or to its absence if the disease is absent. We should not care about imprecisions in esti mating the probabilities or other sources of noise in the system if they do not affect the expected probability. In other words, any symmetrical distribution of noise around the "gold standard" probability will not affect the score of the system.
For example, suppose that in a set of cases with findings F, the probability of d is e a s e D being present, P(DIF) = 0.7, and that a diagnostic expert system A, computes a poste rior probability forD of PA(DIF). The score for this per formance, computed as above, as the probability assigned to the correct diagnosis, is given by:
If we assume that A is well-calibrated, so that PA(DIF )=0.7, the score is
Now consider a diagnostic expert system, B, which is sub ject to severe random noise, such that it estimates the pos terior probability of D half the time P 8(DIF)= I and half the time P8(DIF)=0.4. Note that B is still well-calibrated because the expected probability given by B over the noise is given by E[P8(D I F)] = 0.5 x 1 + 0.5 x 0.4 = 0.7. The score for B will be:
In other words, the score is the same for expert systems A and B. More generally, A and B will have the same score provided the noise to which B is subject does not change the expected value of the posterior probability estimated by B, i.e.
Therefore, any kind of noise in B's estimates PB(D I F) that does not affect the expectation of the estimate will not degrade the performance of B using an average measure. In some cases, of course, B may do worse than A -but in other cases it will do better. On the average it will do the same. In this way, probability is unlike other quantities of interest - such as, a patient's blood pressure or the net present value of an investment- where imprecision in the measurement may affect the utility of the measurement even if it does not affect the expected value.
4 EFFECT OF LOGODDS NORMAL ERROR
If symmetric uncertainty about probabilities has no effect on results, what effect might asymmetric uncertainty have? There is reason to believe that uncertainty about probabilities may often be asymmetric. For example, an expert may believe that a finding, F, is very probable given a disease, D, but not certain. Suppose the expert pro vides P( FID )=p, with p=0.9 as her best estimate of the conditional probability, but feels quite uncertain. Her belief that the relationship is not certain implies that p < 1.0. However, she may well feel that p = 0 . 7 would not be surprising. The tight upper bound and loose lower value suggest an asymmetric distribution.
We can also provide a mathematical argument for asym metric posterior probabilities for diagnosis with many uncertain sources of evidence. Suppose that we have n findings Fi for i=l ton that are conditionally independent, given a disease D. Using the standard log-odds formula tion of Bayes' rule, we have:
Let us view the uncertain link probabilities P(Fi ID) and P(Fi \D) as random variables. The posterior logodds is therefore the sum of differences between n pairs of ran dom variables. By the central limit theorem, the distribu tion over the logodds posterior will tend with increasing n to a normal distribution. Equivalently, the posterior odds will tend to a lognormal distribution and the posterior probability will tend to a logodds-normal distribution. This is one of the reasons we used logodds-nonnal noise in the experiments described above. The logodds-normal distri bution is, in general, asymmetric in probabilitty.
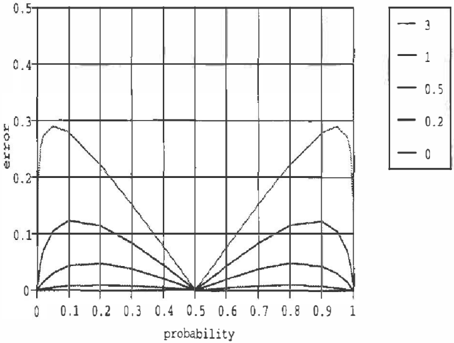
Let us examine the effect of a logodds-normal uncertainty in posterior probabilities on the diagnostic performance of a belief network. Figure 6 shows the expected error, that is the absolute average difference in scores (probability assigned to true diagnoses) between "gold standard" prob ability and the noisy probability, as a function of the gold standard. The noise is applied as a logodds-normal with a varying beween 0 and 3, as shown on the key.
For a gold-standard probability of 0.5, the expected error is zero. This result arises because the logodds-normal dis tribution is symmetric around 0.5. The expected error is also zero for gold standard probability near 0 or 1. The expected error is largest for intermediate probabilities. The largest expected error for cr = 0.3 is about 0.021 at about p=0.25 and p=0.75. Larger expected errors occur for at extreme noise levels of cr = 1.0 and cr = 3.0. As we have mentioned before, noise levels of cr � 1.0 are very extreme. For such values of cr, the second-order probabil ity density functions are bimodal, with peaks at 0 and 1 Figure 2
5 CONCLUSIONS
A better understanding of sensitivity to errors or noise in numerical probability can help guide the builder of belief networks in deciding how much effort it is worth putting into probability assessment-whether probabilities are assessed directly by experts, or estimated empirically from collected patient case data. It could also help us under stand what levels of precision in diagnosis we can expect g i ven the inevitable imprecision in the input probabilities. A better understanding of the relative sensitivity to links, leaks, and priors could help guide the knowledge engineer in allocating effort in assessing these three classes of prob ability.
In this paper, we have examined the sensitivity of several belief networks on diagnostic performance to imprecision in the representation of the numerical probabilities. Over all, we have found a surprising level of robustness to imprecision in the probabilities. Here we summarize the key findings, explore their implications, and discuss their limitations.
The addition of massive amounts of random noise to the link, leak, and prior probabilities produced only modest
decrements in diagnostic performance. Noise in the link probabilities had the larg e s t effect in reducing perfor mance for all three networks. Noise in the leak and prior probabilities had s m al le r effects, but performance consis tently degraded with the level of noise for all thr e e net works.
The surprisingly small effect of large amounts of random noise should be reassuring for those constructing belief networks. The results presented here-together with addi tional results f r o m studies [Pradhan, Henrion, Provan, Del Favero, and Huang, 1996] of different m a ppi n g s , reduc tions in the number of levels used (e.g., severities of dis eases and fin d i n gs ) , and studies of the impact of unrepresented nodes (e.g., diseases not present in the CPCS s u bnetw orks ) -p ro vi d e e m p ir i cal evidence that it is much more i m p o rt a nt to obtain t h e c o rr e c t qu a l i ta t i ve information. It is more important to id e nt if y findings, and dis e ases , IPSs, and their relationships, than to quantify the relations with a high level of precision. Experience sug gests that domain experts are much more comfortable pro viding these kinds of qualitative knowledge than they are p r o v i d i n g qua nti t ative p r o ba b i l it ies, although use o f prob ability elicitation methods can make the latter more acceptable. Knowledge that high levels of p re c i s i on are not necessary should gr e at ly improve acceptance of these techniques.
Ultimately the purpose of any diagnostic system is to lead to better decisions-more cost-effective treatments of dis eases, or repair to complex artifacts. In this paper, we have measured performance by accuracy of di agn osi s, not by improved decisions. However, if imprecision in the repre sentation does not degrade the diagnosis, it should not degrade the decision. In general, diagnostic accuracy is more sensitive to imprecision in the model of system being diagnosed than is the quality of the decision. Therefore, where we find that the quality of diagnosis is robust to imprecision, we can be confident that the quality of deci sions will be equally or more robust.
While we believe that these results provide intriguing and suggestive evidence, we should caution that they should not be viewed as definitive for all BN s. First, note that these results are for a diagnostic application. There is rea son to believe that predictive applications may show gre a t e r sensitivity. Second, these networks, like most existing large BNs, use noisy-OR influences, or their gen eralization to noisy MAX influences. In fact, in most diag nostic belief networks constructed hitherto, the large majori t y of influences are noisy OR links. But, BNs that make extensive use of other types of influence may show different sensitivities.
In addition, our results are s p e c i fi c to the types of noise and the measure of diagnostic performance studied here. It would be interesting to study noise intended t o mode systematic c o g n i t i v e biases that have been observed in psychological studies of probability elicitation and human reasoning under u n ce rtainty .
It may be possible to improve on our measure of perfor- mance. Our experiments and our performance measure have a major advantage over some alternatives that gauge consistency with a diagnostic network's a sse ss m e n t of probability. Because we generate the test data, we know whether diseases are actually p re se n t in the test cases. Our measure reflects "real" d ia g n o s ti c accuracy in that it takes account of the true d i a g n os e s rather than relying com pletely on subjective assessments, such as might be pro vided by an expert. On the other hand, our measure is not a proper scoring rule. (A scoring rule is proper if it m a xi mizes the expected score of an assessor when they report their true assessment of pr o b a b i liti es . ) Since our measure is a l i n e ar score, it can reward assignments by noisy net works that disagree with th e assignments of noise-free net works. Also, unlike some scoring rules, (e.g., the Brier score), our m ea su r e does not separate different aspects of performance such as calibration errors and disc r i m i n a t i o n between different levels of probability. It may also be worthwhile to develop methods to account for differences between the frequencies that are present in the test data and the empirical frequencies used to construct the net work and the frequencies that are seen in actual d i ag nos tic practice.
Clearly, there is a need for additional work to explore these possibilities. While we believe that further e x p e r i m e nta l work is essential, we expect that theoretical analysis will also help to provide a deeper understanding of some of the findings, and suggest profitable avenues for further experi mentation.
We are not the first to argue that the conclusions of diag nostic and other expert systems may have low sensitivity to imprecision in the numerical parameters. H ow e v e r, in heuristic r e pre s e n t a tion s where both the structural assump tions e m bo d y u ne x p li c at e d simplifications of principles of rationality, it is often hard to separate the question of numerical approximations from structural sim pl i fic at io ns . In the context of a pr ob ab i l is ti c belief network, it is po s si ble to be clear about both structural s i m p l ific a tio ns , such as independence a s su m p t i on s , and the effects of n u m e rica l approximation, and so d i ff er e nt i a te among these potential sources of e rr o r, in a way that is impossible in heuristic representations of uncertainty.
Our results lend support for the value of qualitative proba bilistic representations, such as the QPNs [Wellman 1990, Henrion a n d Druzdzel 1990] an d infinitesimal probability schemes [Goldszmidt and Pearl 1992].lndeed, we have performed some initial experimental comparisons of the performance of a BN for machine diagnosis using a quali tative infinitesimal representation (the 1C c al c u lus ) with a numerical BN. We found little difference in diagnostic performance between the numerical and infinitesimal rep re se n ta t io ns for cases with small f a u lt p r io rs [Henrion, et al. 1994]. The fin d ing s w e h a v e p r e se n ted here help to explain the small differences between t he qualitative and quantitative r epre s e n tat i o n s.
6 ACKNOWLEDGEMENTS
This work was supported by NSF grant IRI 91-20330 to the Institute for Decision Systems Research. We would like to thank Joseph Kahn for providing feedback and commentary on earlier drafts, Dr. Blackford Middleton for his help in developing CPCS-BN, and Lyn Dupre for her editorial help.
7 REFERENCES
[Goldszmidt and Pearl 1992] Goldszmidt, M. and Pearl, J. (1992). Reasoning with qualitative probabilities can be tractable. Proceedings of the Eighth Conference on Uncer tainty in Artificial Intelligence, Stanford. San Mateo, Cali fornia, Morgan Kaufmann.
[Beckerman and Miller 1986] Beckerman, D. E. and R. A. Miller ( 1986). Towards a better understanding of the INTERNIST-I knowledge base. Proceedings of Medinfo, 27-31, Washington, DC, New York, North-Holland.
[Henrion 1988] Henrion, M. (1988). Propagation of uncer tainty by probabilistic logic sampling in Bayes' networks. Uncertainty in Artificial Intelligence 2, pages 149-163. J. F. Lemmer and L. N. Kana!. Amsterdam, North Holland: 149-164.
[Henrion, et al. 1994] Henrion, M., A. Darwiche, Gold zmidt, M., Provan, G., and Del Favaro, B. (1994). An experimental comparison of infinitesimal and numerical probabilities for diagnostic reasoning. Proceedings of the Fifth Workshop on the Principles of Diagnosis, pages 131-139, New Paltz, NY.
[Henrion and Druzdzel 1990] Henrion, M. and M. J. Druzdzel (1990). Qualitative and linguistic explanations of probabilistic reasoning in belief networks. Proceedings of the Sixth Conference on Uncertainty in Artificial Intelli gence, pages 10-20 Cambridge, MA, Association for Uncertainty in AI.
[Kahneman, et al.l982] Kahneman, D., Slavic, P., and Tversky, A. Eds. (1982). Judgement under uncertainty: Heuristics and biases. Cambridge, Cambridge University Press.
[Middleton, et al. 1991] Middleton, B., Shwe, M., Hecker man, D. E., Henrion, M., Horvitz, E. J., Lehmann, H., and Cooper, G. F. (1991). Probabilistic diagnosis using a refor mulation of the Internist-1/QMR knowledge base: II. Eval uation of diagnostic performance. Methods of lnfonnation in Medicine,30: 256-267.
[Miller, et al. 1986} Miller, R. A., F. E. Masarie, and Myers, J. (1986). Quick medical reference (QMR) for diagnostic assistance. Medical Computing, 3(5): 34-48.
[Miller, et al. 1982] Miller, R. A., H. E. Pople, et al. (1982). Internist-!: An experimental computer-based Diagnostic Consultant for General Internal Medicine. New England Journal of Medicine, 307: 468-76.
[Parker and Miller 1987} Parker, R. and Miller, R. (1987).
Using Causal Knowledge to create simulated patient cases: the CPCS project as an extension of INTERNIST-I. Proceedings of the Eleventh Annual Symposium on Com puter Applications in Medical Care, pages 473-480, Wash ington, D.C., New York, IEEE.
[Pradhan, et al., 1996] Pradhan, M., Henrion, M., Provan, G., Del Favero, B., and Huang, K. (1996). The sensitivity of belief networks to imprecise probabilities: An experi mental investigation. Artificial Intelligence.
[Pradhan, et al,1994] Pradhan, M., G. Provan, Middleton, B., and Henrion, M. (1994). Knowledge engineering for large Belief networks. Proceedings of the Tenth Confer ence on Uncertainty and Artificial Intelligence, pages 484490 Seattle, WA, Morgan Kaufmann, San Francisco.
[Shwe, et al. 1991] Shwe, M., B. F. Middleton, Hecker man, D. E., Henrion, M., Horvitz, E. J., Lehmann, H., and Cooper, G. F. (1991 ). Probabilistic diagnosis using a refor mulation of the Intemist-1/QMR Knowledge Base: I. The probabilistic model and inference algorithms. Methods of lnfonnation in Medicine, 30: 241--255.
[Wellman 1990] Wellman, M. P. (1990). Graphical infer ence in qualitative probabilistic networks. Networks 2 0 ( 5 ) : 687-701.