Publication
Metrics
AI Quick Summary
Researchers created a 4D data cube from radio-interferometric spectroscopic imaging of the solar corona, allowing for simultaneous tracking of emission in four dimensions: time, frequency, angle, and position.
Paper Preview
Abstract
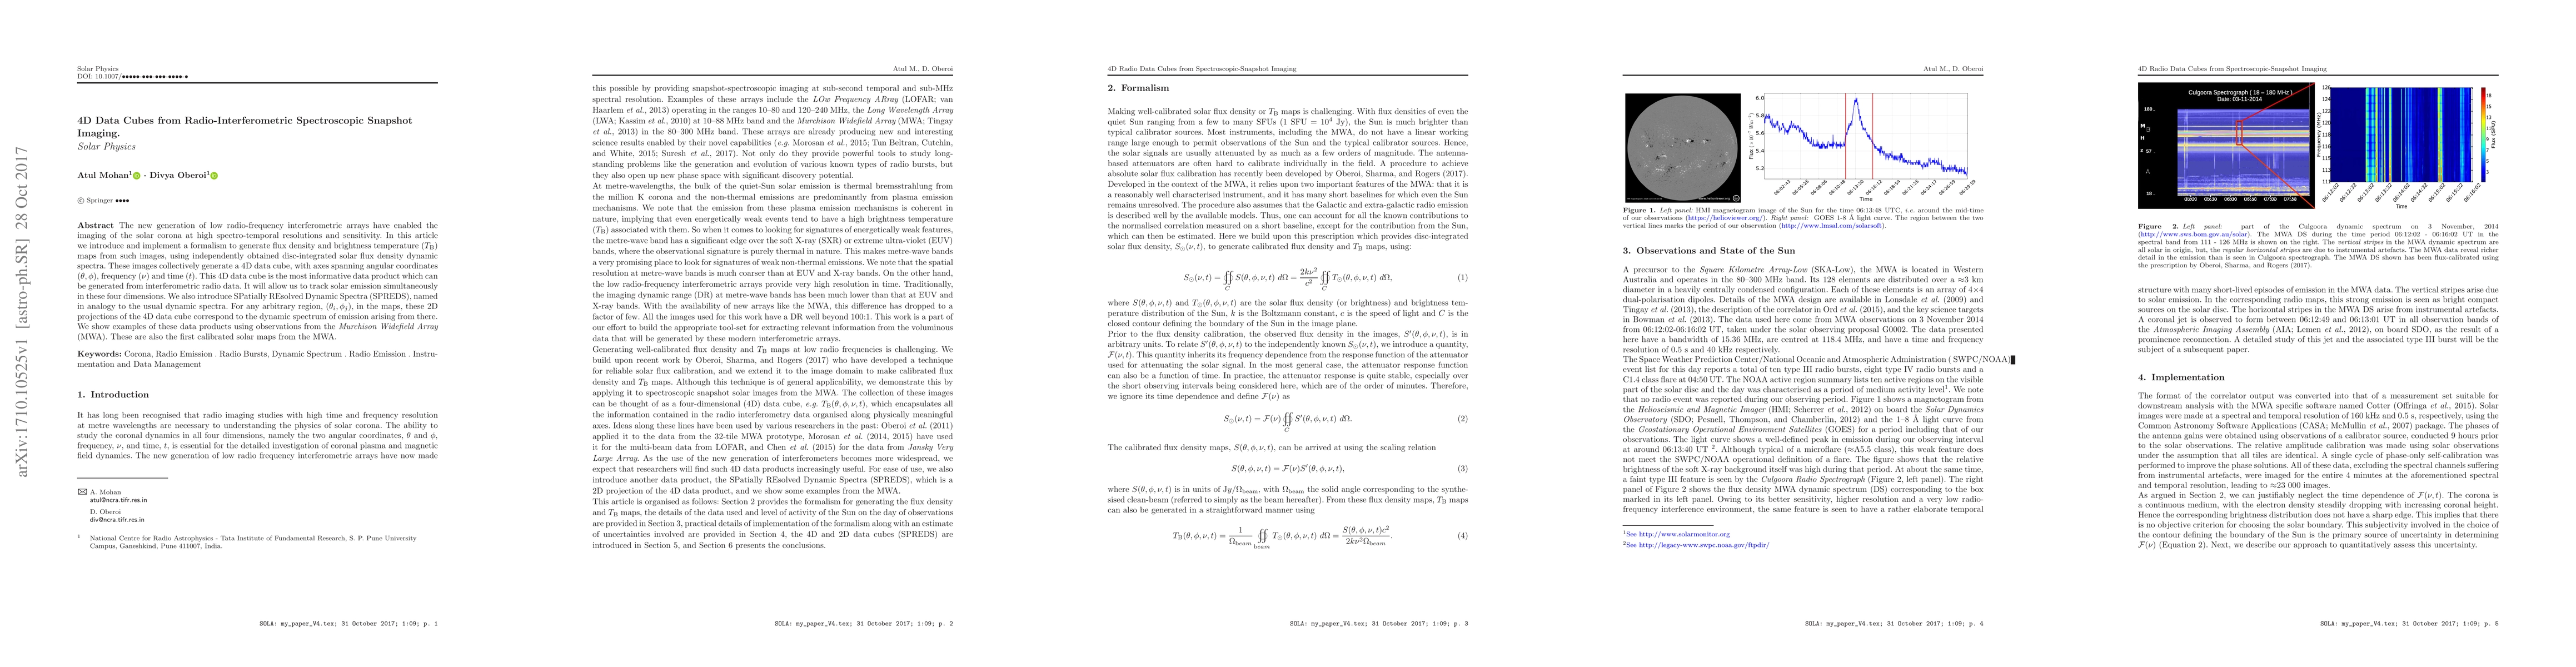
The new generation of low radio-frequency interferometric arrays have enabled the imaging of the solar corona at high spectro-temporal resolutions and sensitivity. In this article we introduce and implement a formalism to generate flux density and brightness temperature ($T_{\mathrm B}$) maps from such images, using independently obtained disc-integrated solar flux density dynamic spectra. These images collectively generate a 4D data cube, with axes spanning angular coordinates ($\theta,\phi$), frequency ($\nu$) and time ($t$). This 4D data cube is the most informative data product which can be generated from interferometric radio data. It will allow us to track solar emission simultaneously in these four dimensions. We also introduce SPatially REsolved Dynamic Spectra (SPREDS), named in analogy to the usual dynamic spectra. For any arbitrary region, ($\theta_i,\phi_j$), in the maps, these 2D projections of the 4D data cube correspond to the dynamic spectrum of emission arising from there. We show examples of these data products using observations from the Murchison Widefield Array (MWA). These are also the first calibrated solar maps from the MWA.
AI Key Findings
Get AI-generated insights about this paper's methodology, results, significance, and more — seven facets brought into focus.
Impact
Paper Details
PDF Preview
Key Terms
Citation Network
Current paper (gray), citations (green), references (blue)
Display is limited for performance on very large graphs.
Discussion 0