Publication
Metrics
AI Quick Summary
Researchers compared three methods for analyzing genomic data using Gaussian Graphical Models: Moore-Penrose pseudoinverse, residual correlation, and covariance-regularized method. They found that the regularized methods performed similarly but one was faster, while stability varied between methods.
Paper Preview
Abstract
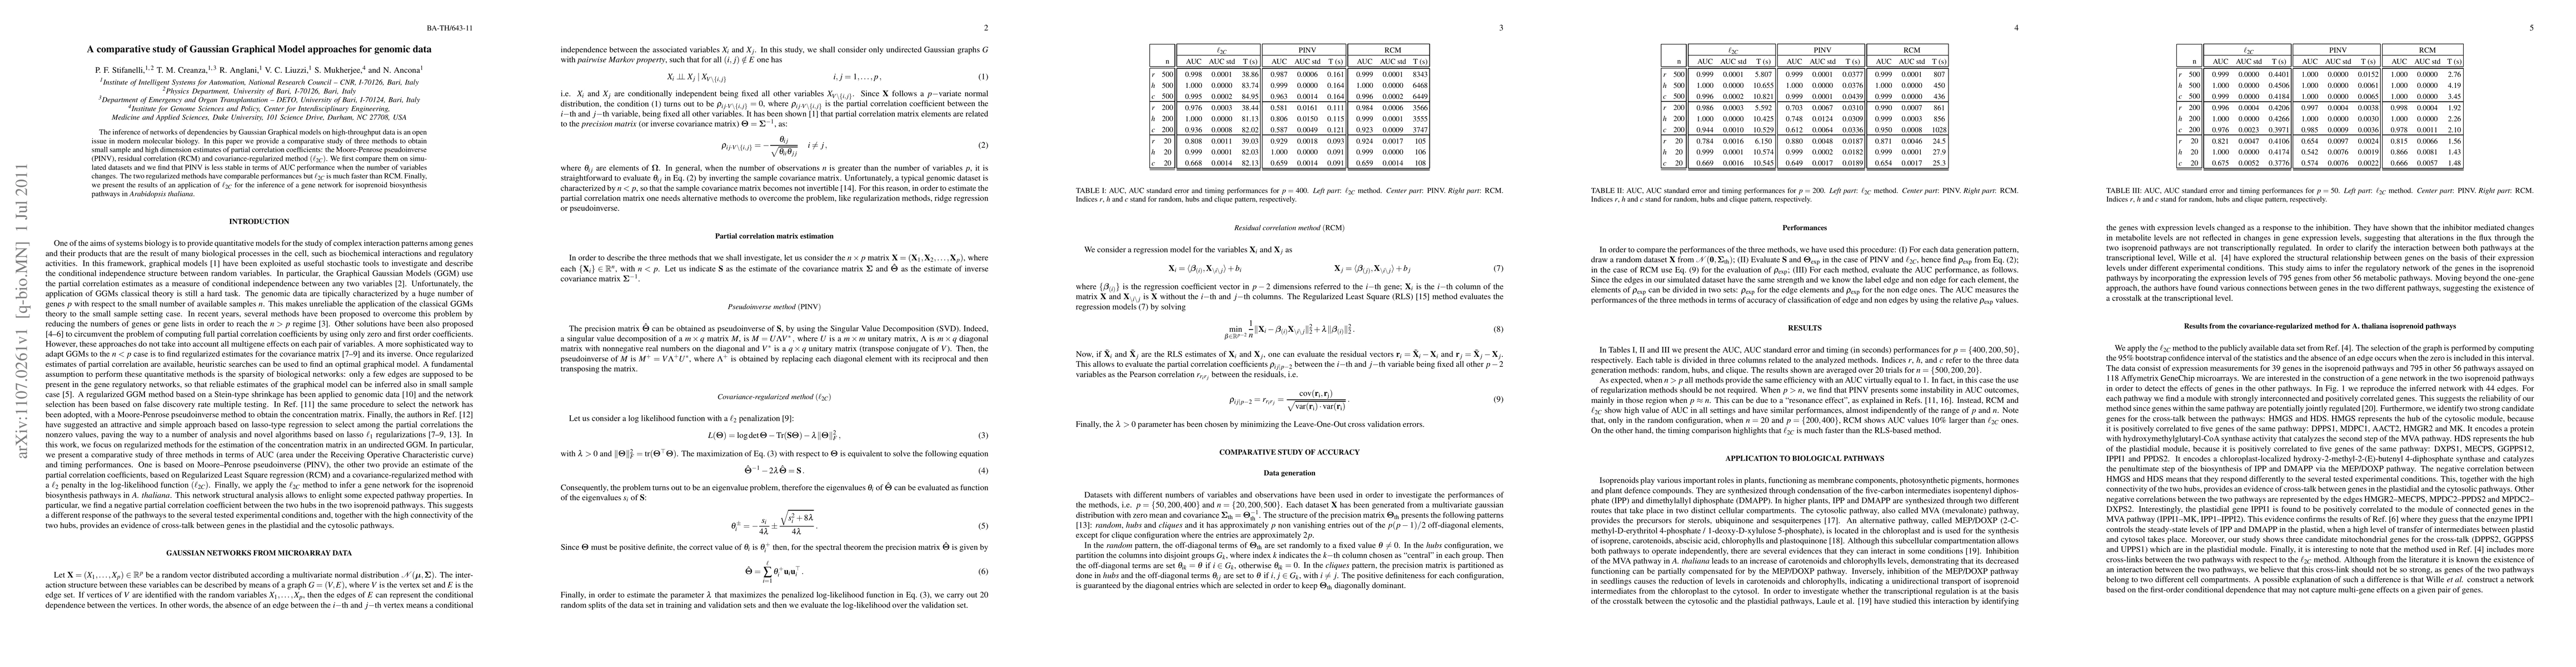
The inference of networks of dependencies by Gaussian Graphical models on high-throughput data is an open issue in modern molecular biology. In this paper we provide a comparative study of three methods to obtain small sample and high dimension estimates of partial correlation coefficients: the Moore-Penrose pseudoinverse (PINV), residual correlation (RCM) and covariance-regularized method $(\ell_{2C})$. We first compare them on simulated datasets and we find that PINV is less stable in terms of AUC performance when the number of variables changes. The two regularized methods have comparable performances but $\ell_{2C}$ is much faster than RCM. Finally, we present the results of an application of $\ell_{2C}$ for the inference of a gene network for isoprenoid biosynthesis pathways in Arabidopsis thaliana.
AI Key Findings
Get AI-generated insights about this paper's methodology, results, significance, and more — seven facets brought into focus.
Impact
Paper Details
Authors
PDF Preview
Key Terms
Citation Network
Current paper (gray), citations (green), references (blue)
Display is limited for performance on very large graphs.
Discussion 0