A framework for leveraging machine learning tools to estimate personalized survival curves
Publication
Metrics
AI Quick Summary
This paper proposes a framework for estimating personalized survival curves using machine learning tools, decomposing the conditional survival function into observable regression models to bypass censoring and truncation complexities. The authors assess the performance of various estimation procedures and demonstrate their method on an HIV vaccine trial dataset.
Paper Preview
Abstract
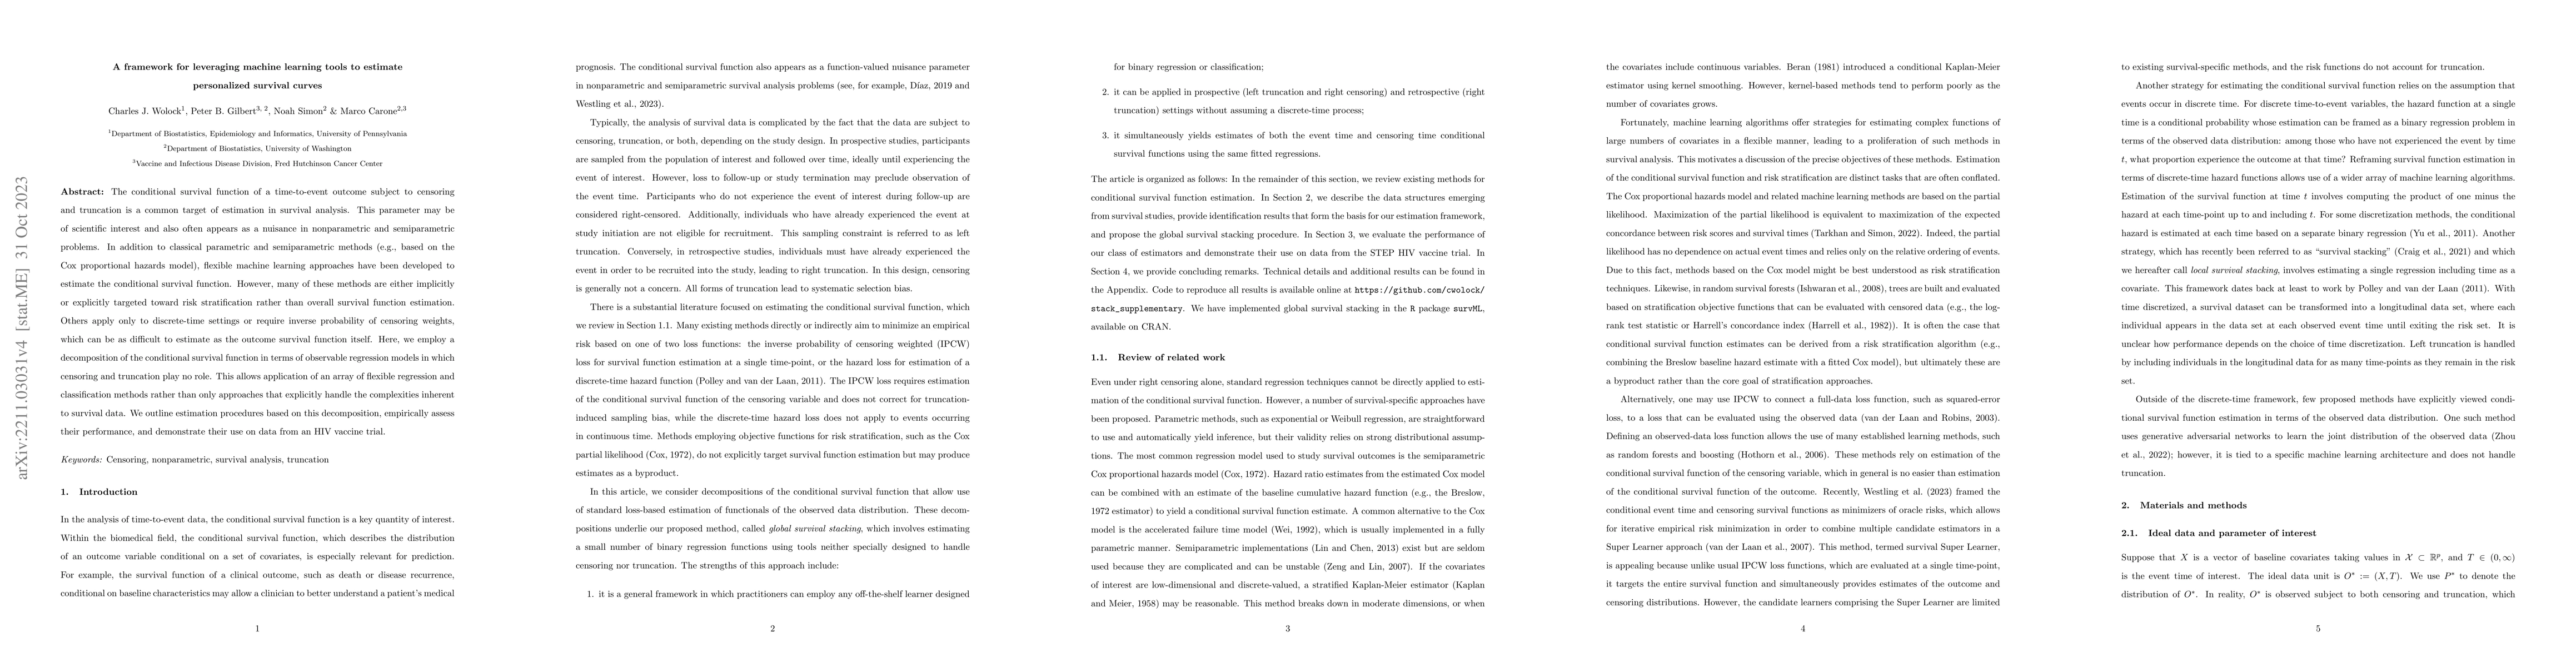
The conditional survival function of a time-to-event outcome subject to censoring and truncation is a common target of estimation in survival analysis. This parameter may be of scientific interest and also often appears as a nuisance in nonparametric and semiparametric problems. In addition to classical parametric and semiparametric methods (e.g., based on the Cox proportional hazards model), flexible machine learning approaches have been developed to estimate the conditional survival function. However, many of these methods are either implicitly or explicitly targeted toward risk stratification rather than overall survival function estimation. Others apply only to discrete-time settings or require inverse probability of censoring weights, which can be as difficult to estimate as the outcome survival function itself. Here, we employ a decomposition of the conditional survival function in terms of observable regression models in which censoring and truncation play no role. This allows application of an array of flexible regression and classification methods rather than only approaches that explicitly handle the complexities inherent to survival data. We outline estimation procedures based on this decomposition, empirically assess their performance, and demonstrate their use on data from an HIV vaccine trial.
AI Key Findings
Get AI-generated insights about this paper's methodology, results, significance, and more — seven facets brought into focus.
Impact
Paper Details
Authors
PDF Preview
Key Terms
Citation Network
Current paper (gray), citations (green), references (blue)
Display is limited for performance on very large graphs.
Discussion 0