A graphical framework for interpretable correlation matrix models
Publication
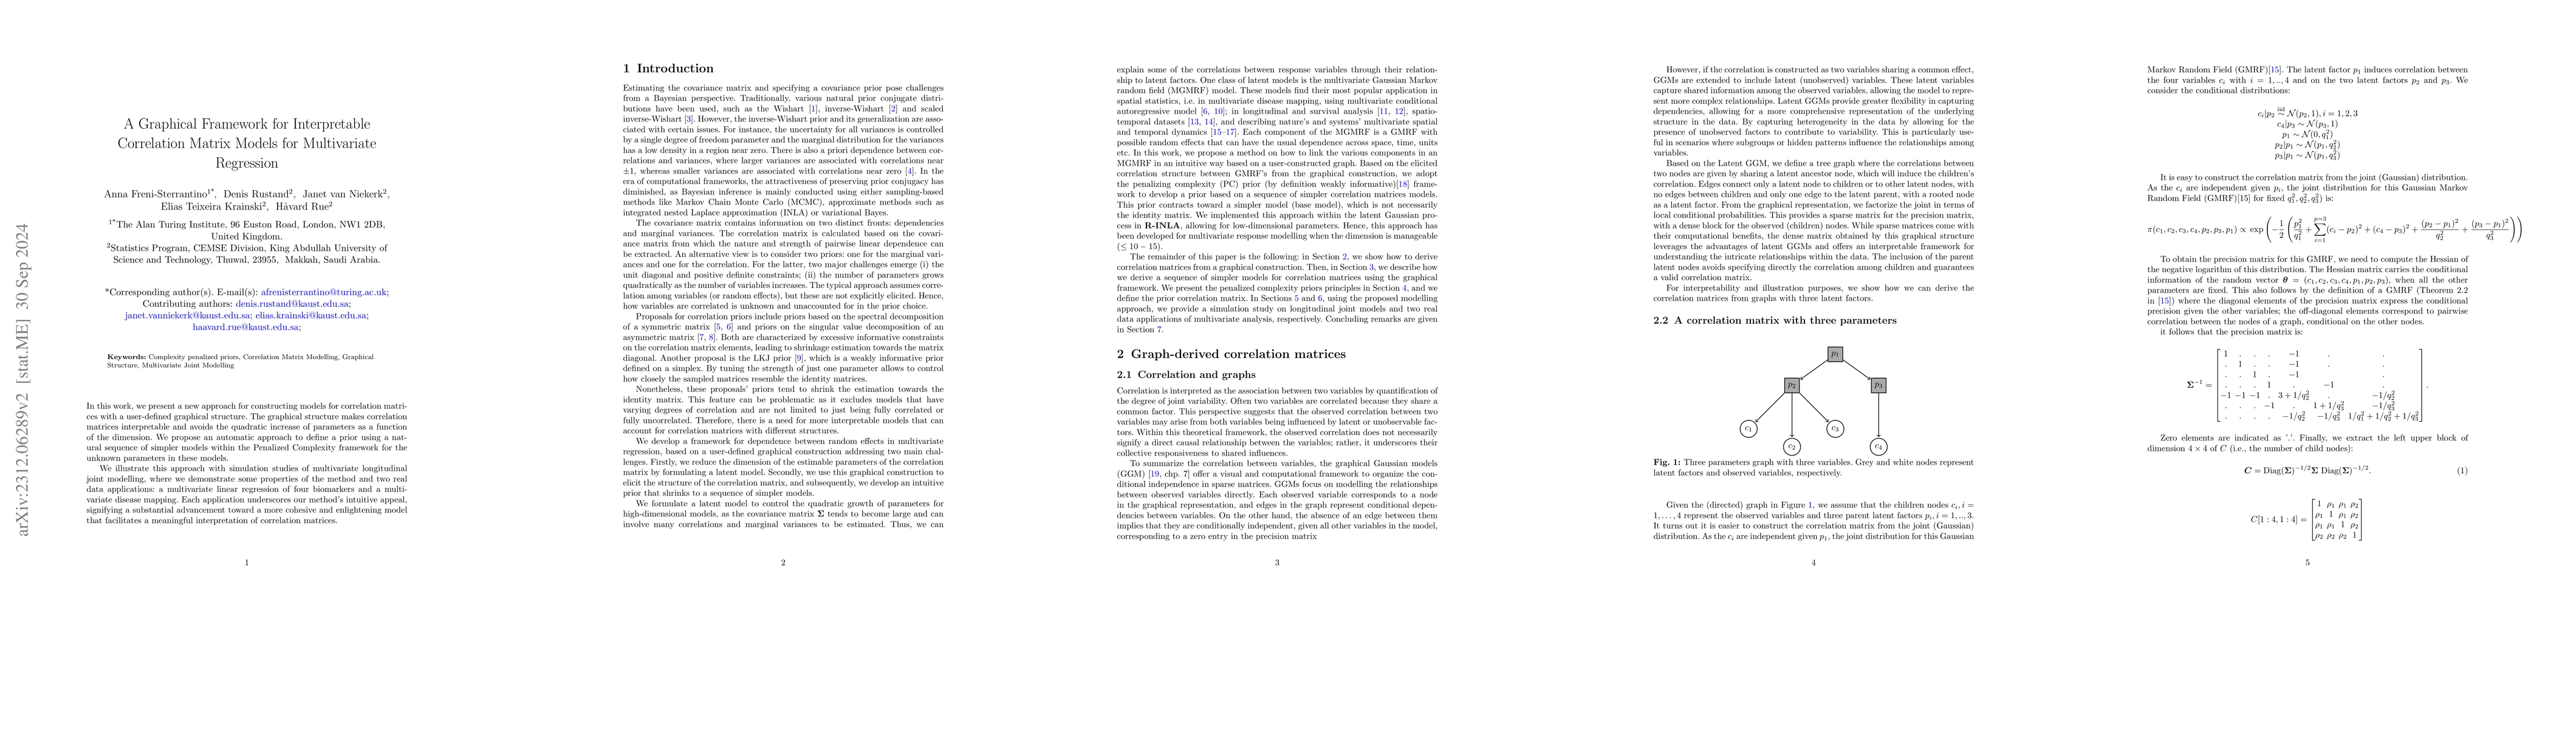
Metrics
AI Quick Summary
This paper introduces a graphical framework for constructing interpretable correlation matrix models, avoiding parameter explosion with dimension. It employs an automatic prior definition within the Penalized Complexity framework and demonstrates its effectiveness through applications in multivariate linear regression, disease mapping, and longitudinal joint modeling.
Paper Preview
Abstract
In this work, we present a new approach for constructing models for correlation matrices with a user-defined graphical structure. The graphical structure makes correlation matrices interpretable and avoids the quadratic increase of parameters as a function of the dimension. We suggest an automatic approach to define a prior using a natural sequence of simpler models within the Penalized Complexity framework for the unknown parameters in these models. We illustrate this approach with three applications: a multivariate linear regression of four biomarkers, a multivariate disease mapping, and a multivariate longitudinal joint modelling. Each application underscores our method's intuitive appeal, signifying a substantial advancement toward a more cohesive and enlightening model that facilitates a meaningful interpretation of correlation matrices.
AI Key Findings
Get AI-generated insights about this paper's methodology, results, significance, and more — seven facets brought into focus.
Impact
Paper Details
Authors
PDF Preview
Key Terms
Citation Network
Current paper (gray), citations (green), references (blue)
Display is limited for performance on very large graphs.
Discussion 0