A Point-cloud Clustering & Tracking Algorithm for Radar Interferometry
Publication
Metrics
AI Quick Summary
This paper introduces a density-based clustering algorithm, utilizing DBSCAN, to automatically identify and track clusters of radar echoes in large datasets from ionospheric radars. The method effectively tracks turbulent structures in the E-region ionosphere, correlating radar observations with auroral motions and discussing deviations due to electric field modulations.
Paper Preview
Abstract
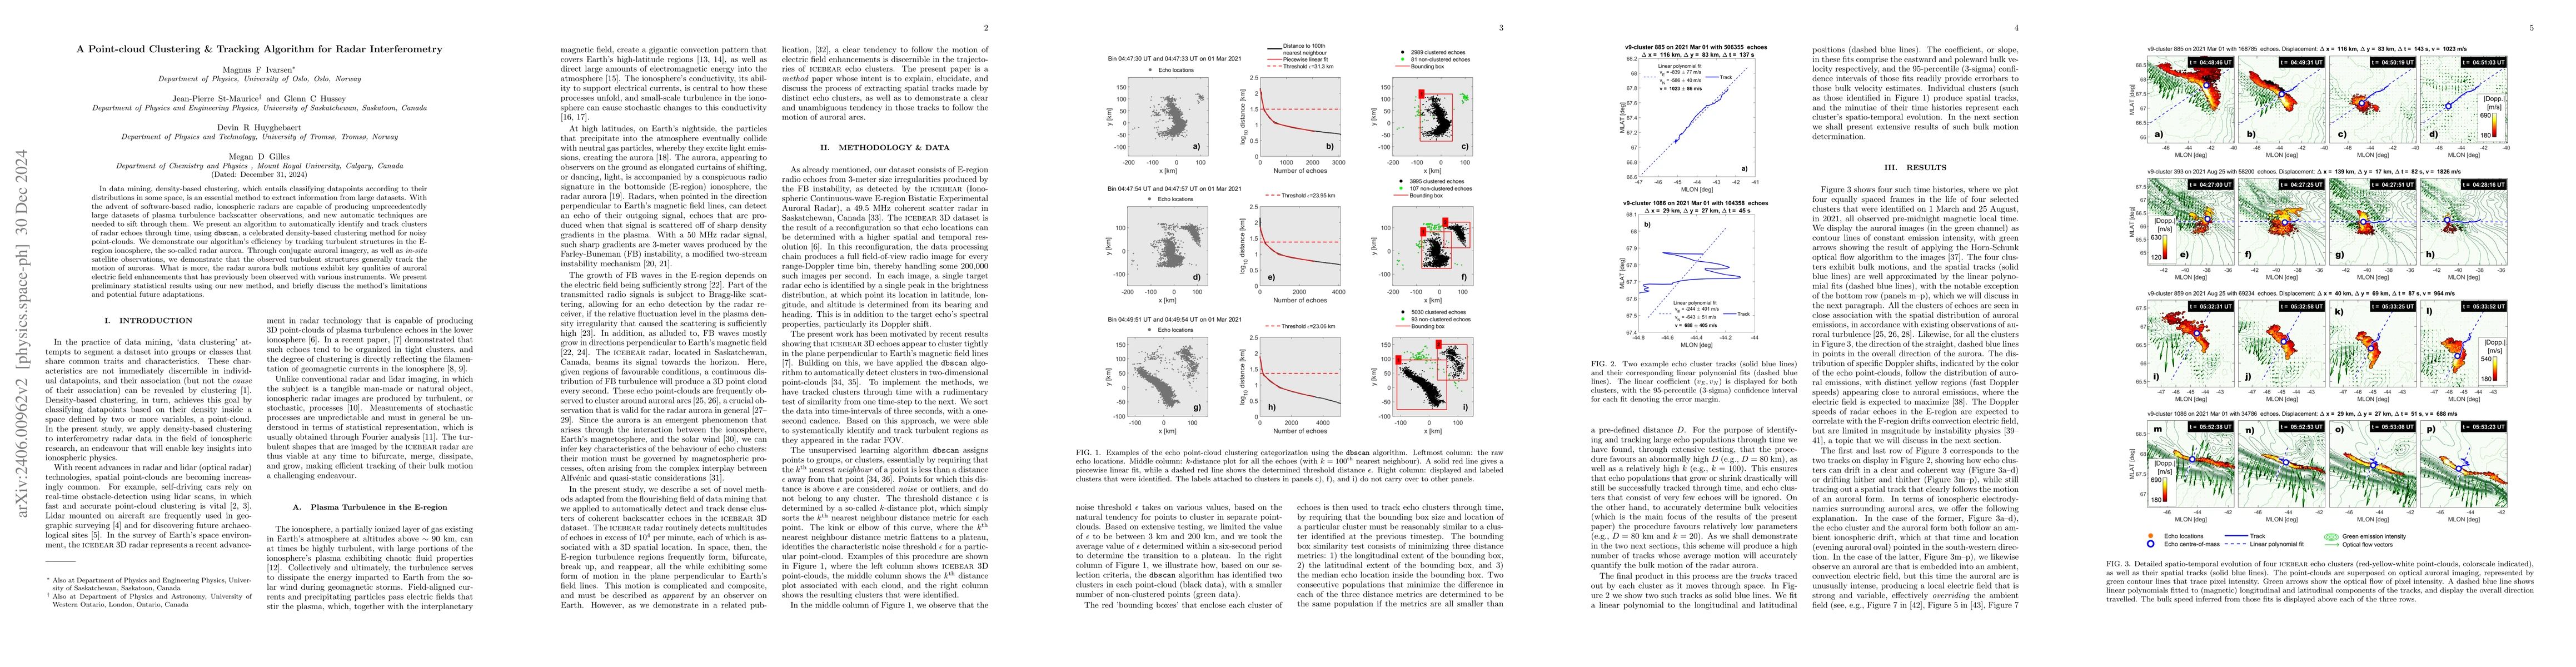
In data mining, density-based clustering, which entails classifying datapoints according to their distributions in some space, is an essential method to extract information from large datasets. With the advent of software-based radio, ionospheric radars are capable of producing unprecedentedly large datasets of plasma turbulence backscatter observations, and new automatic techniques are needed to sift through them. We present an algorithm to automatically identify and track clusters of radar echoes through time, using dbscan, a celebrated density-based clustering method for noisy point-clouds. We demonstrate its efficiency by tracking turbulent structures in the E-region ionosphere, the so-called radar aurora. Through conjugate auroral imagery, as well as in-situ satellite observations, we demonstrate that the observed turbulent structures generally track the motion of the aurora. We discuss instances when this prediction is brought to fruition and when it ostensibly is not. Through case studies, we highlight the important instances when the radar echo bulk motions vary considerably around discrete auroral arcs, an effect we argue is produced by strong electric field modulations caused by energetic particle precipitation.
AI Key Findings
Get AI-generated insights about this paper's methodology, results, significance, and more — seven facets brought into focus.
Impact
Paper Details
Authors
PDF Preview
Key Terms
Citation Network
Current paper (gray), citations (green), references (blue)
Display is limited for performance on very large graphs.
Discussion 0