A Scalable Data-Driven Framework for Systematic Analysis of SEC 10-K Filings Using Large Language Models
Publication
Metrics
AI Quick Summary
This paper introduces a scalable data-driven framework leveraging large language models to systematically analyze SEC 10-K filings for evaluating company performance and strategy changes. The proposed system automates the extraction and preprocessing of 10-K filings, utilizes Cohere's Command-R+ LLM for generating quantitative ratings, and provides interactive visualizations for actionable insights.
Paper Preview
Abstract
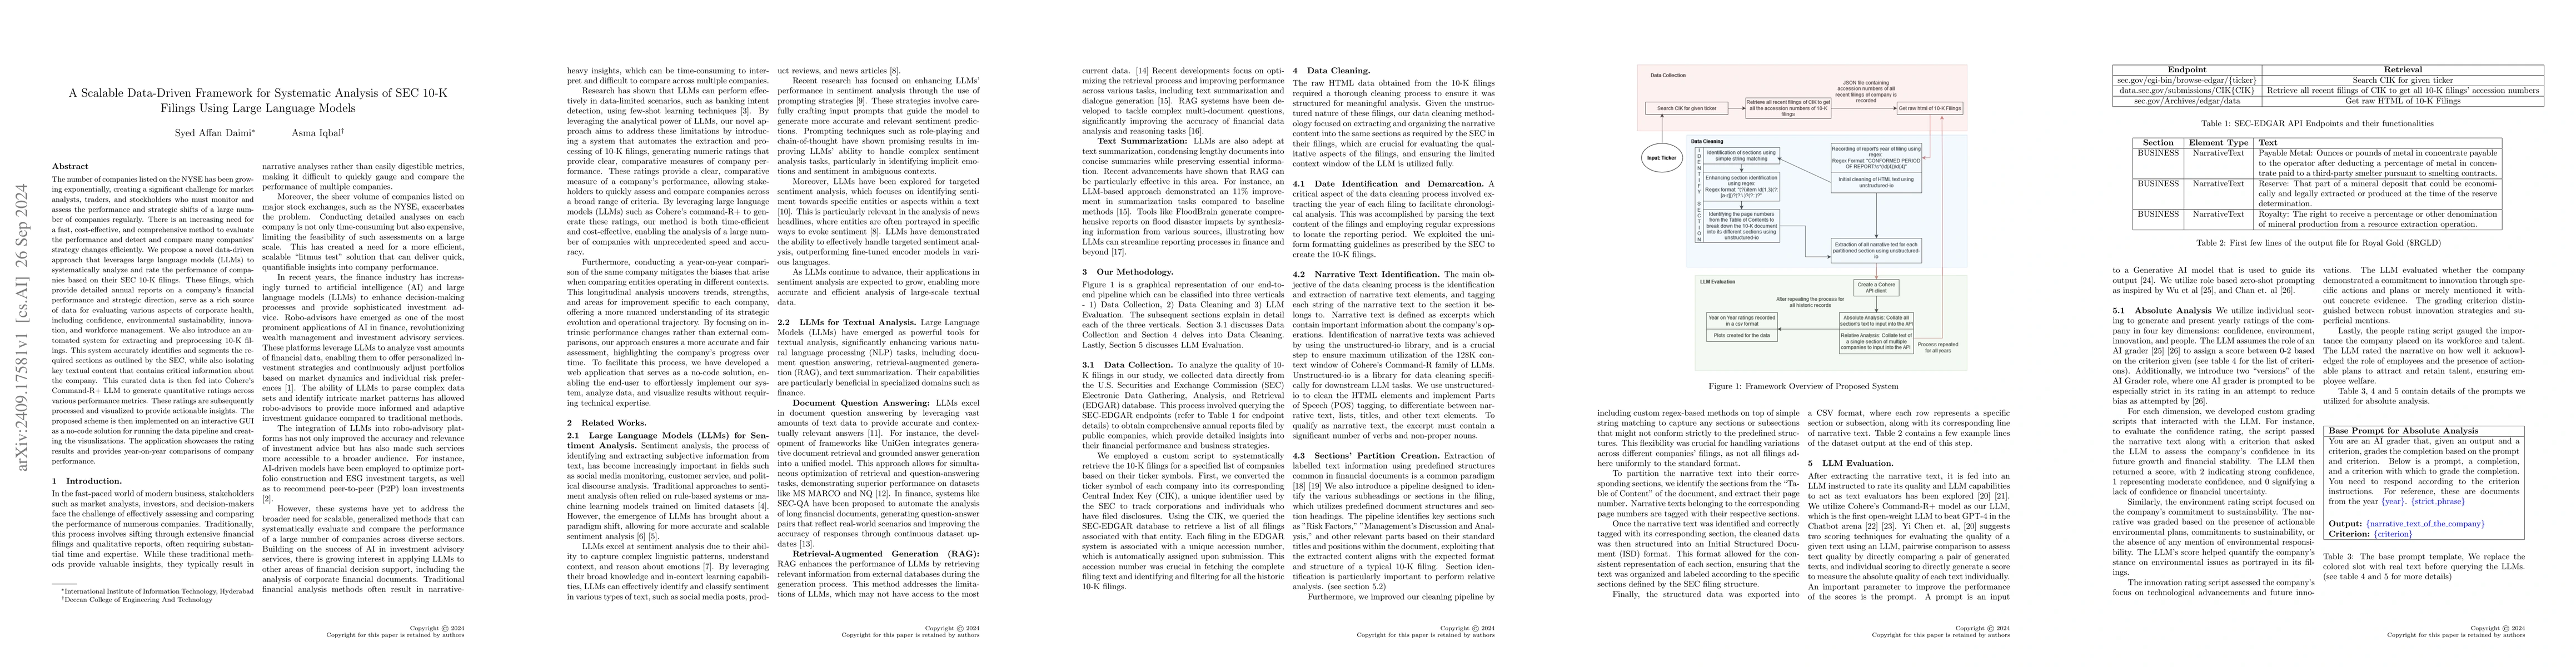
The number of companies listed on the NYSE has been growing exponentially, creating a significant challenge for market analysts, traders, and stockholders who must monitor and assess the performance and strategic shifts of a large number of companies regularly. There is an increasing need for a fast, cost-effective, and comprehensive method to evaluate the performance and detect and compare many companies' strategy changes efficiently. We propose a novel data-driven approach that leverages large language models (LLMs) to systematically analyze and rate the performance of companies based on their SEC 10-K filings. These filings, which provide detailed annual reports on a company's financial performance and strategic direction, serve as a rich source of data for evaluating various aspects of corporate health, including confidence, environmental sustainability, innovation, and workforce management. We also introduce an automated system for extracting and preprocessing 10-K filings. This system accurately identifies and segments the required sections as outlined by the SEC, while also isolating key textual content that contains critical information about the company. This curated data is then fed into Cohere's Command-R+ LLM to generate quantitative ratings across various performance metrics. These ratings are subsequently processed and visualized to provide actionable insights. The proposed scheme is then implemented on an interactive GUI as a no-code solution for running the data pipeline and creating the visualizations. The application showcases the rating results and provides year-on-year comparisons of company performance.
AI Key Findings
Get AI-generated insights about this paper's methodology, results, significance, and more — seven facets brought into focus.
Impact
Paper Details
Authors
PDF Preview
Citation Network
Current paper (gray), citations (green), references (blue)
Display is limited for performance on very large graphs.
Discussion 0