01
MethodologyHow they did it
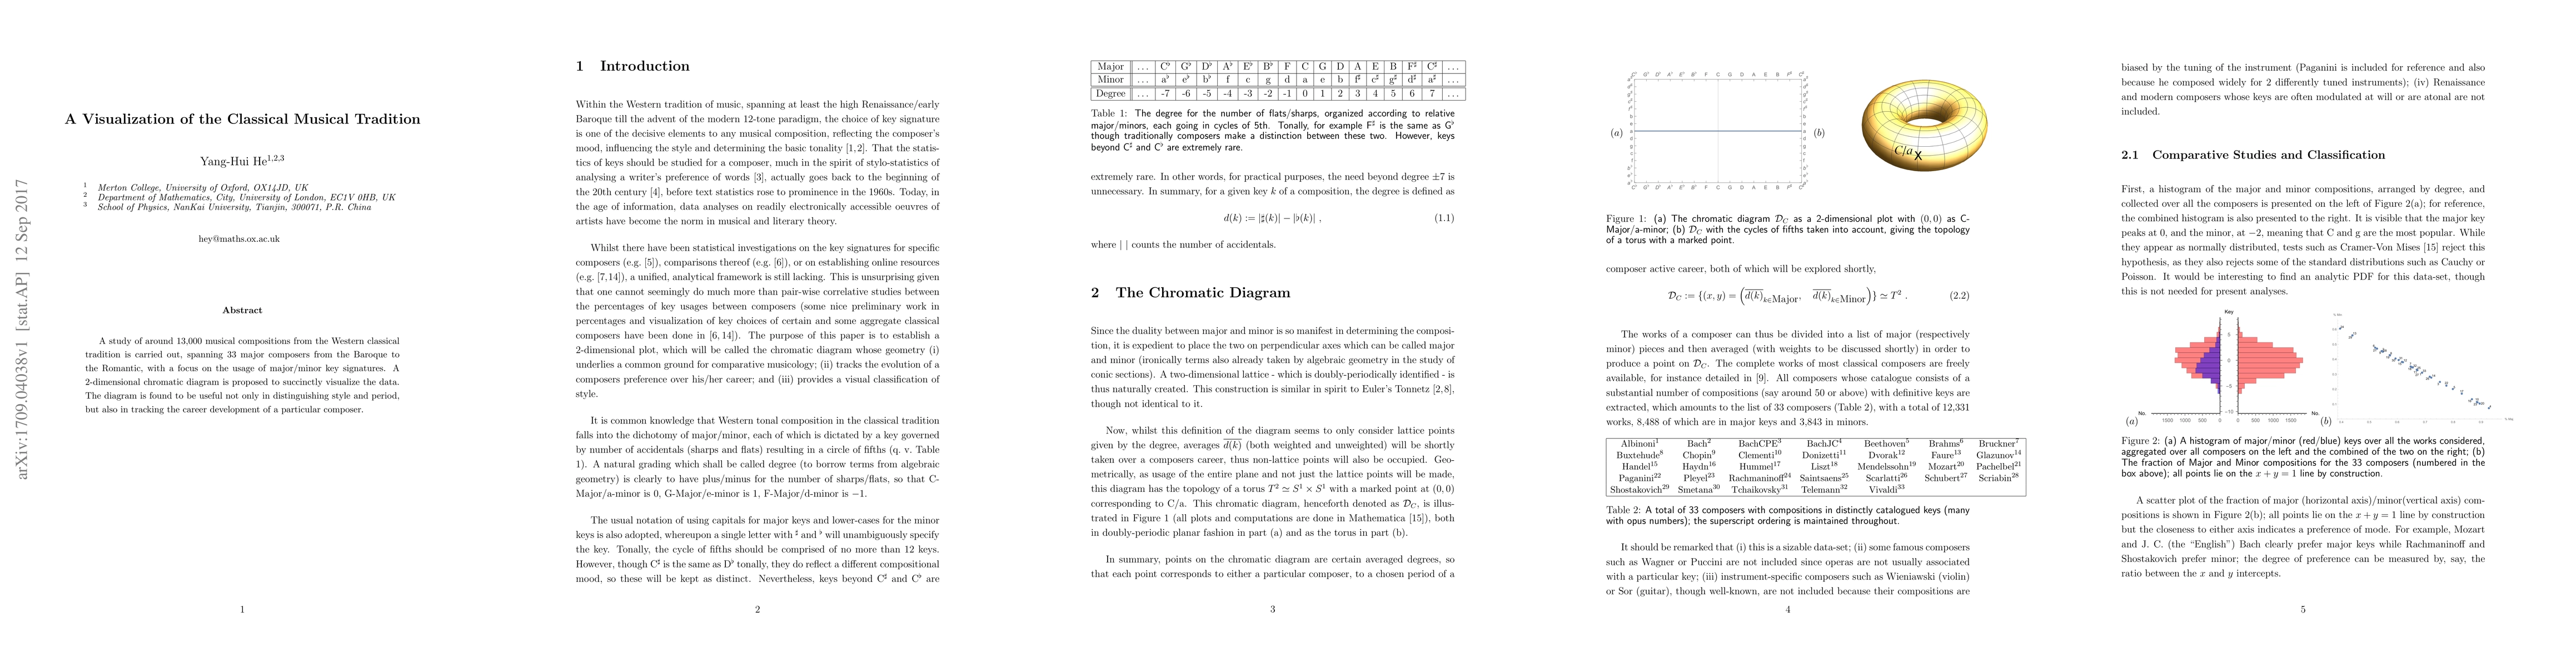
A study of around 13,000 compositions from 33 major composers in the Western classical tradition, analyzing major/minor key signatures using a 2D chromatic diagram.
Discussion 0