Publication
Metrics
AI Quick Summary
This paper introduces GraphVis, a web-based platform for interactive visual graph analytics, enabling real-time exploration and mining of network data through intuitive, dynamic visualizations and analytic techniques. The platform supports dynamic interaction and immediate feedback for hypothesis testing and network understanding.
Paper Preview
Abstract
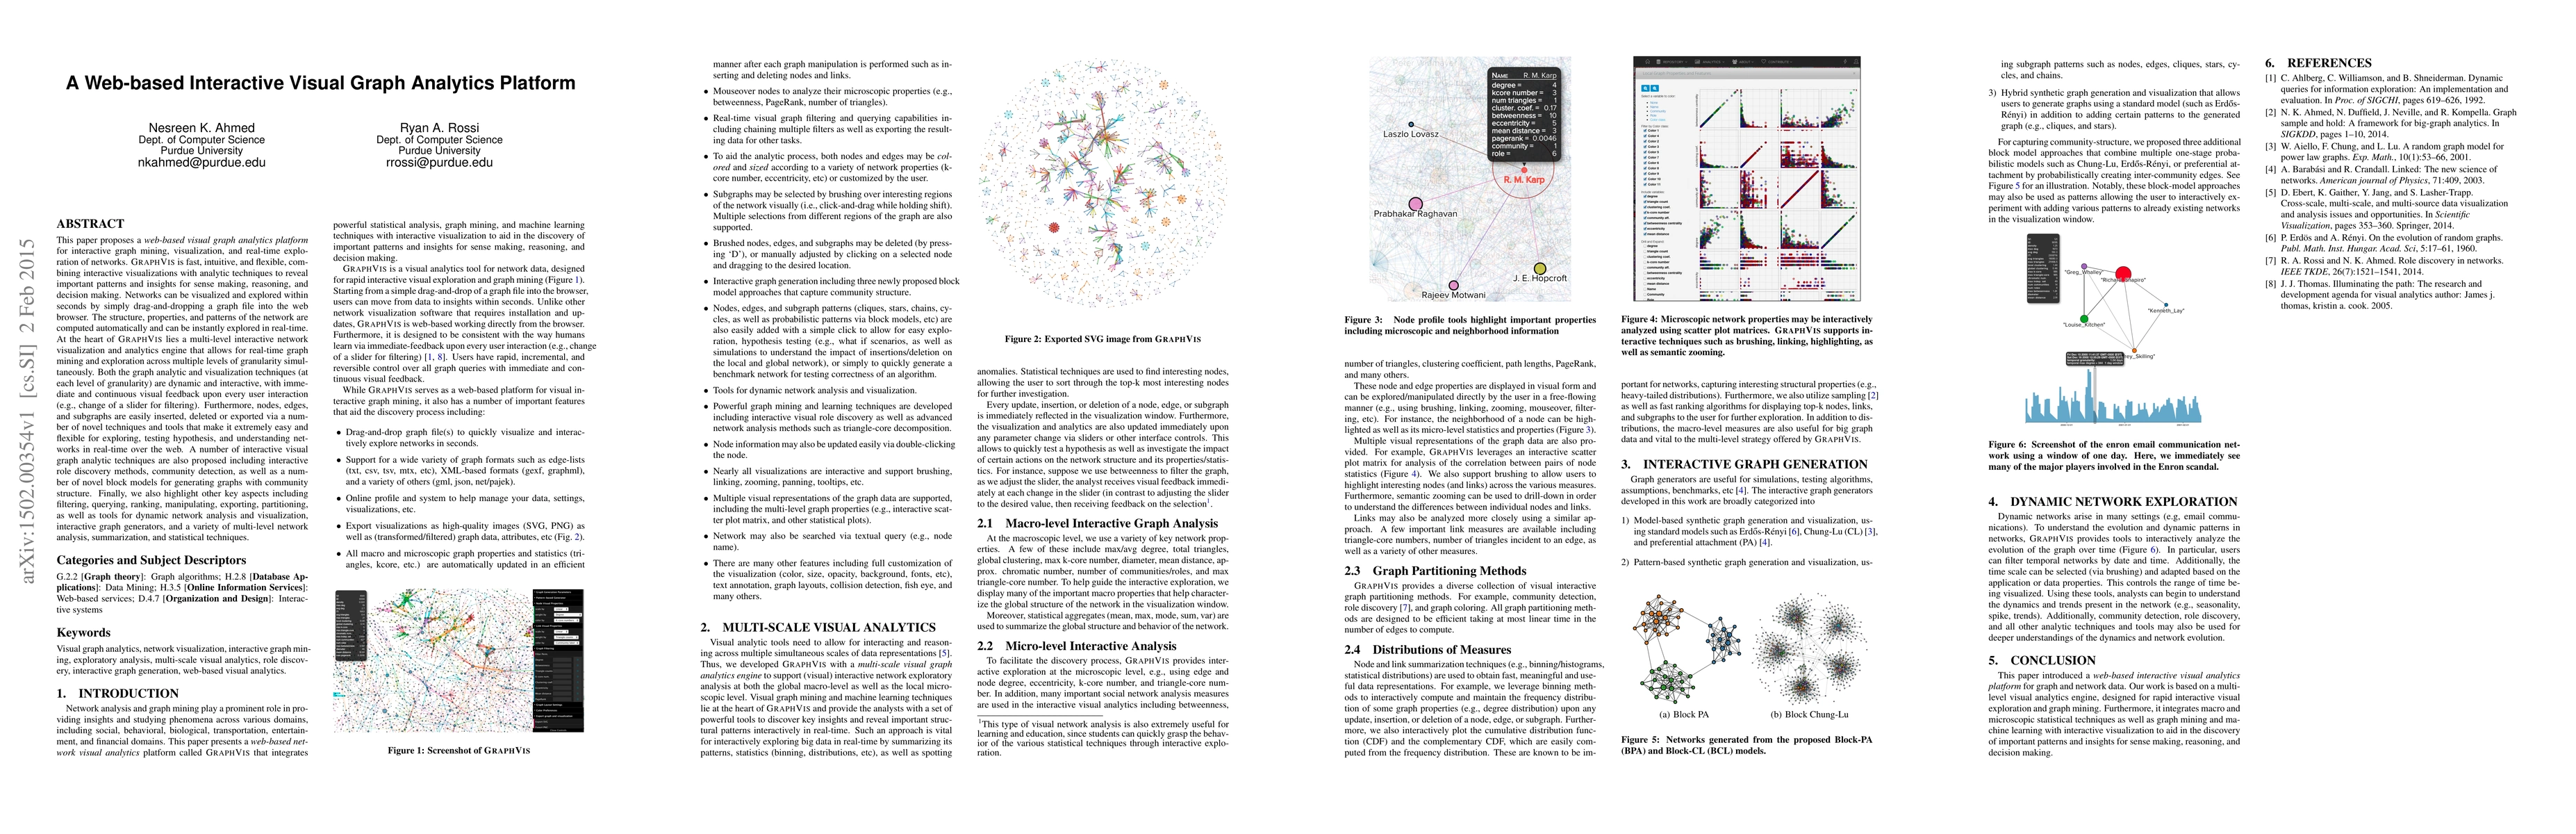
This paper proposes a web-based visual graph analytics platform for interactive graph mining, visualization, and real-time exploration of networks. GraphVis is fast, intuitive, and flexible, combining interactive visualizations with analytic techniques to reveal important patterns and insights for sense making, reasoning, and decision making. Networks can be visualized and explored within seconds by simply drag-and-dropping a graph file into the web browser. The structure, properties, and patterns of the network are computed automatically and can be instantly explored in real-time. At the heart of GraphVis lies a multi-level interactive network visualization and analytics engine that allows for real-time graph mining and exploration across multiple levels of granularity simultaneously. Both the graph analytic and visualization techniques (at each level of granularity) are dynamic and interactive, with immediate and continuous visual feedback upon every user interaction (e.g., change of a slider for filtering). Furthermore, nodes, edges, and subgraphs are easily inserted, deleted or exported via a number of novel techniques and tools that make it extremely easy and flexible for exploring, testing hypothesis, and understanding networks in real-time over the web. A number of interactive visual graph analytic techniques are also proposed including interactive role discovery methods, community detection, as well as a number of novel block models for generating graphs with community structure. Finally, we also highlight other key aspects including filtering, querying, ranking, manipulating, exporting, partitioning, as well as tools for dynamic network analysis and visualization, interactive graph generators, and a variety of multi-level network analysis, summarization, and statistical techniques.
AI Key Findings
Get AI-generated insights about this paper's methodology, results, significance, and more — seven facets brought into focus.
Impact
Paper Details
PDF Preview
Key Terms
Citation Network
Current paper (gray), citations (green), references (blue)
Display is limited for performance on very large graphs.
Discussion 0