Adjustment with Three Continuous Variables
Publication
Metrics
AI Quick Summary
This paper evaluates various statistical adjustment techniques for spurious associations, finding no universally best method. It suggests that causal graphs can aid in selecting appropriate techniques based on specific data-generating processes, and provides R programs for further research.
Paper Preview
Abstract
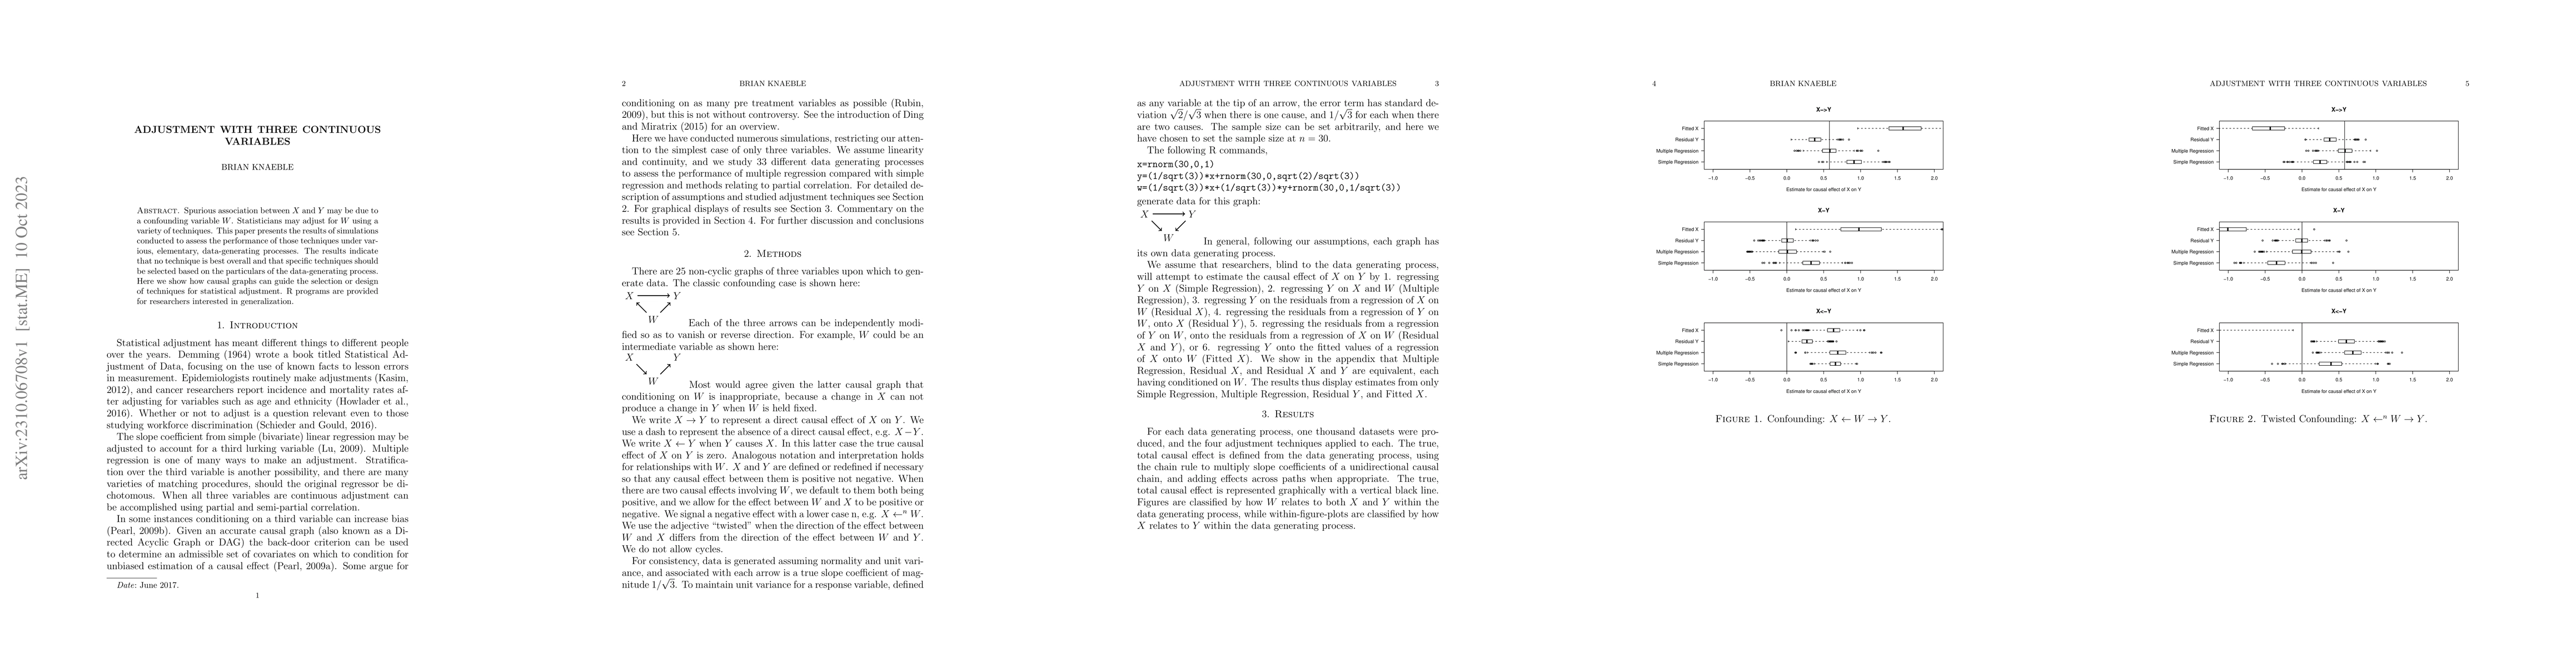
Spurious association between X and Y may be due to a confounding variable W. Statisticians may adjust for W using a variety of techniques. This paper presents the results of simulations conducted to assess the performance of those techniques under various, elementary, data-generating processes. The results indicate that no technique is best overall and that specific techniques should be selected based on the particulars of the data-generating process. Here we show how causal graphs can guide the selection or design of techniques for statistical adjustment. R programs are provided for researchers interested in generalization.
AI Key Findings
Get AI-generated insights about this paper's methodology, results, significance, and more — seven facets brought into focus.
Impact
Paper Details
Authors
PDF Preview
Key Terms
Citation Network
Current paper (gray), citations (green), references (blue)
Display is limited for performance on very large graphs.
Discussion 0