Analysis of Cortical Morphometric Variability Using Labeled Cortical Distance Maps
Publication
Metrics
AI Quick Summary
This paper proposes a method to analyze morphometric variability in cortical structures using Labeled Cortical Distance Maps (LCDM) and the Brown-Forsythe test for homogeneity of variance. The method identifies significant morphometric differences associated with neuro-developmental or neuropsychiatric disorders, demonstrating robustness to assumption violations.
Paper Preview
Abstract
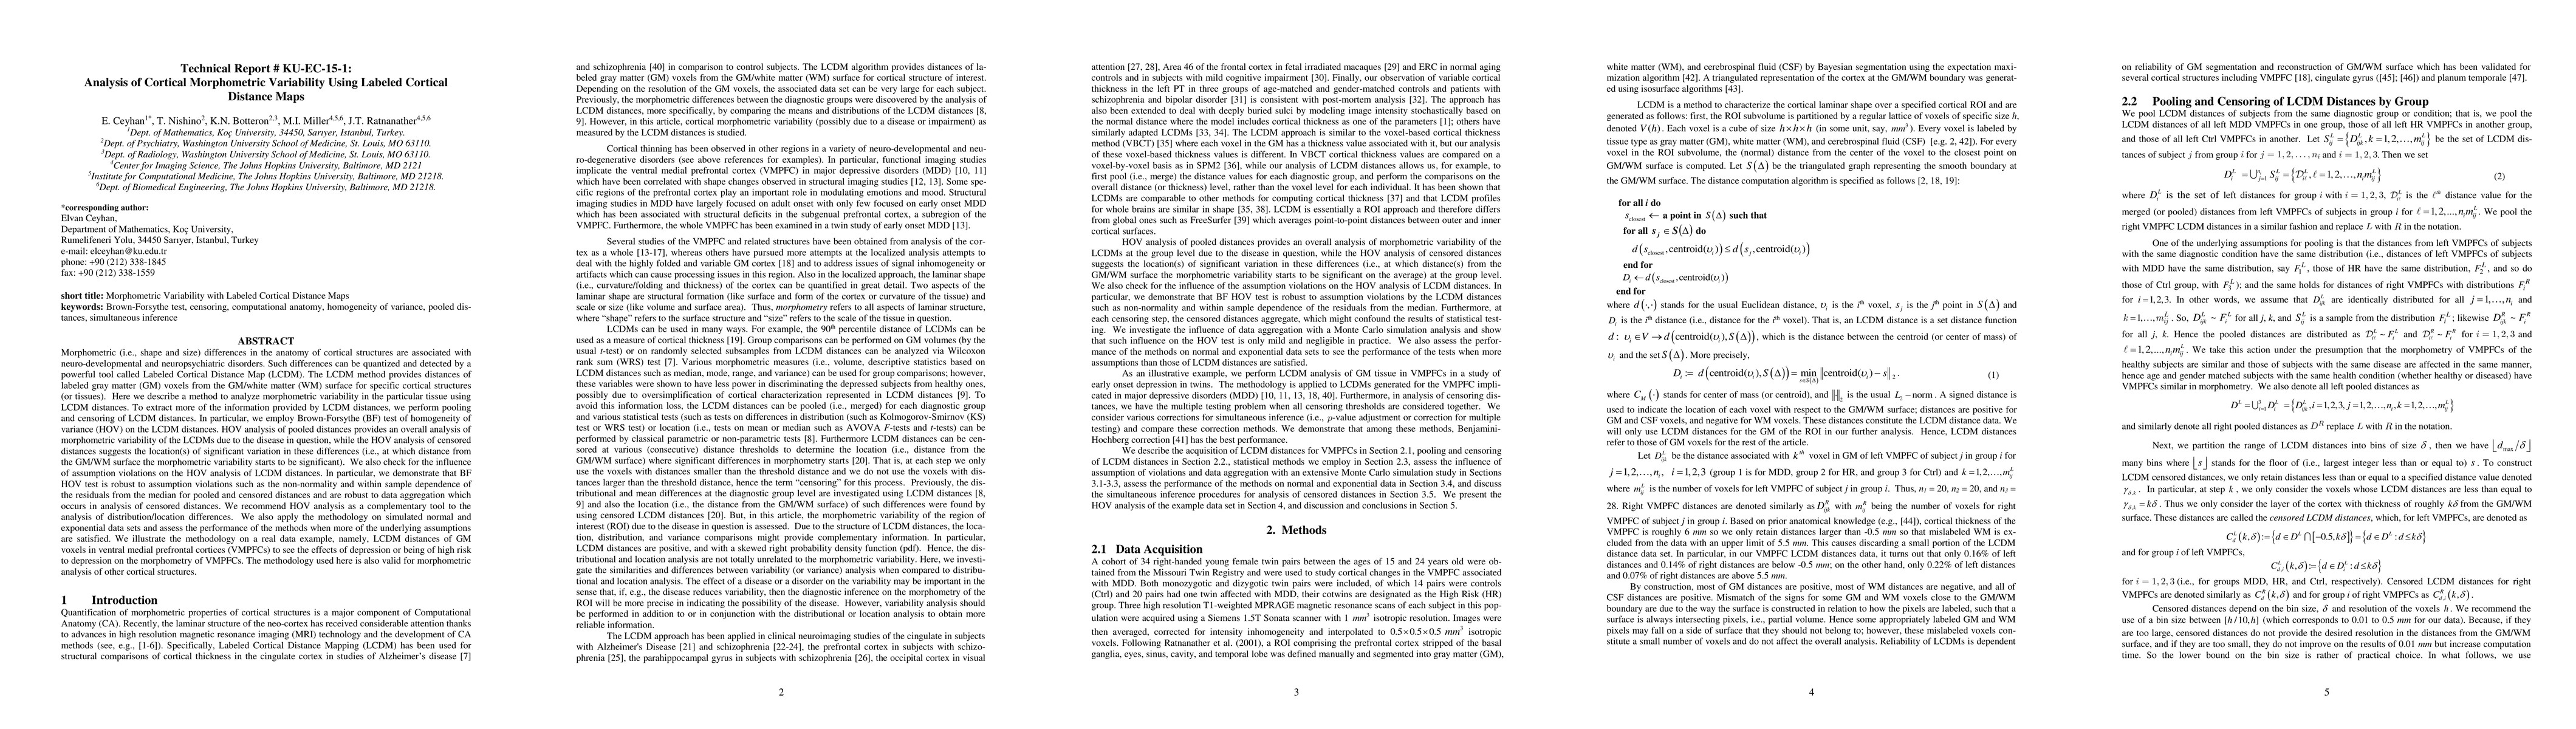
Morphometric differences in the anatomy of cortical structures are associated with neuro-developmental and neuropsychiatric disorders. Such differences can be quantized and detected by a powerful tool called Labeled Cortical Distance Map (LCDM). The LCDM method pro-vides distances of labeled gray matter (GM) voxels from the GM/white matter (WM) surface for specific cortical structures (or tissues). Here we describe a method to analyze morphometric variability in the particular tissue using LCDM distances. To extract more of the information provided by LCDM distances, we perform pooling and censoring of LCDM distances. In particular, we employ Brown-Forsythe (BF) test of homogeneity of variance (HOV) on the LCDM distances. HOV analysis of pooled distances provides an overall analysis of morphometric variability of the LCDMs due to the disease in question, while the HOV analysis of censored distances suggests the location(s) of significant variation in these differences (i.e., at which distance from the GM/WM surface the morphometric variability starts to be significant). We also check for the influence of assumption violations on the HOV analysis of LCDM distances. In particular, we demonstrate that BF HOV test is robust to assumption violations such as the non-normality and within sample dependence of the residuals from the median for pooled and censored distances and are robust to data aggregation which occurs in analysis of censored distances. We illustrate the methodology on a real data example, namely, LCDM distances of GM voxels in ventral medial prefrontal cortices (VMPFCs) to see the effects of depression or being of high risk to depression on the morphometry of VMPFCs. The methodology used here is also valid for morphometric analysis of other cortical structures.
AI Key Findings
Get AI-generated insights about this paper's methodology, results, significance, and more — seven facets brought into focus.
Impact
Paper Details
PDF Preview
Key Terms
Citation Network
Current paper (gray), citations (green), references (blue)
Display is limited for performance on very large graphs.
Discussion 0