Anomaly Detection for Compositional Data using VSI MEWMA control chart
Publication
Metrics
AI Quick Summary
This paper proposes a Phase II MEWMA control chart with variable sampling intervals for monitoring compositional data using an isometric log-ratio transformation. The study evaluates its performance using the Average Time to Signal via Markov chain approach and compares it with the standard MEWMA chart.
Paper Preview
Abstract
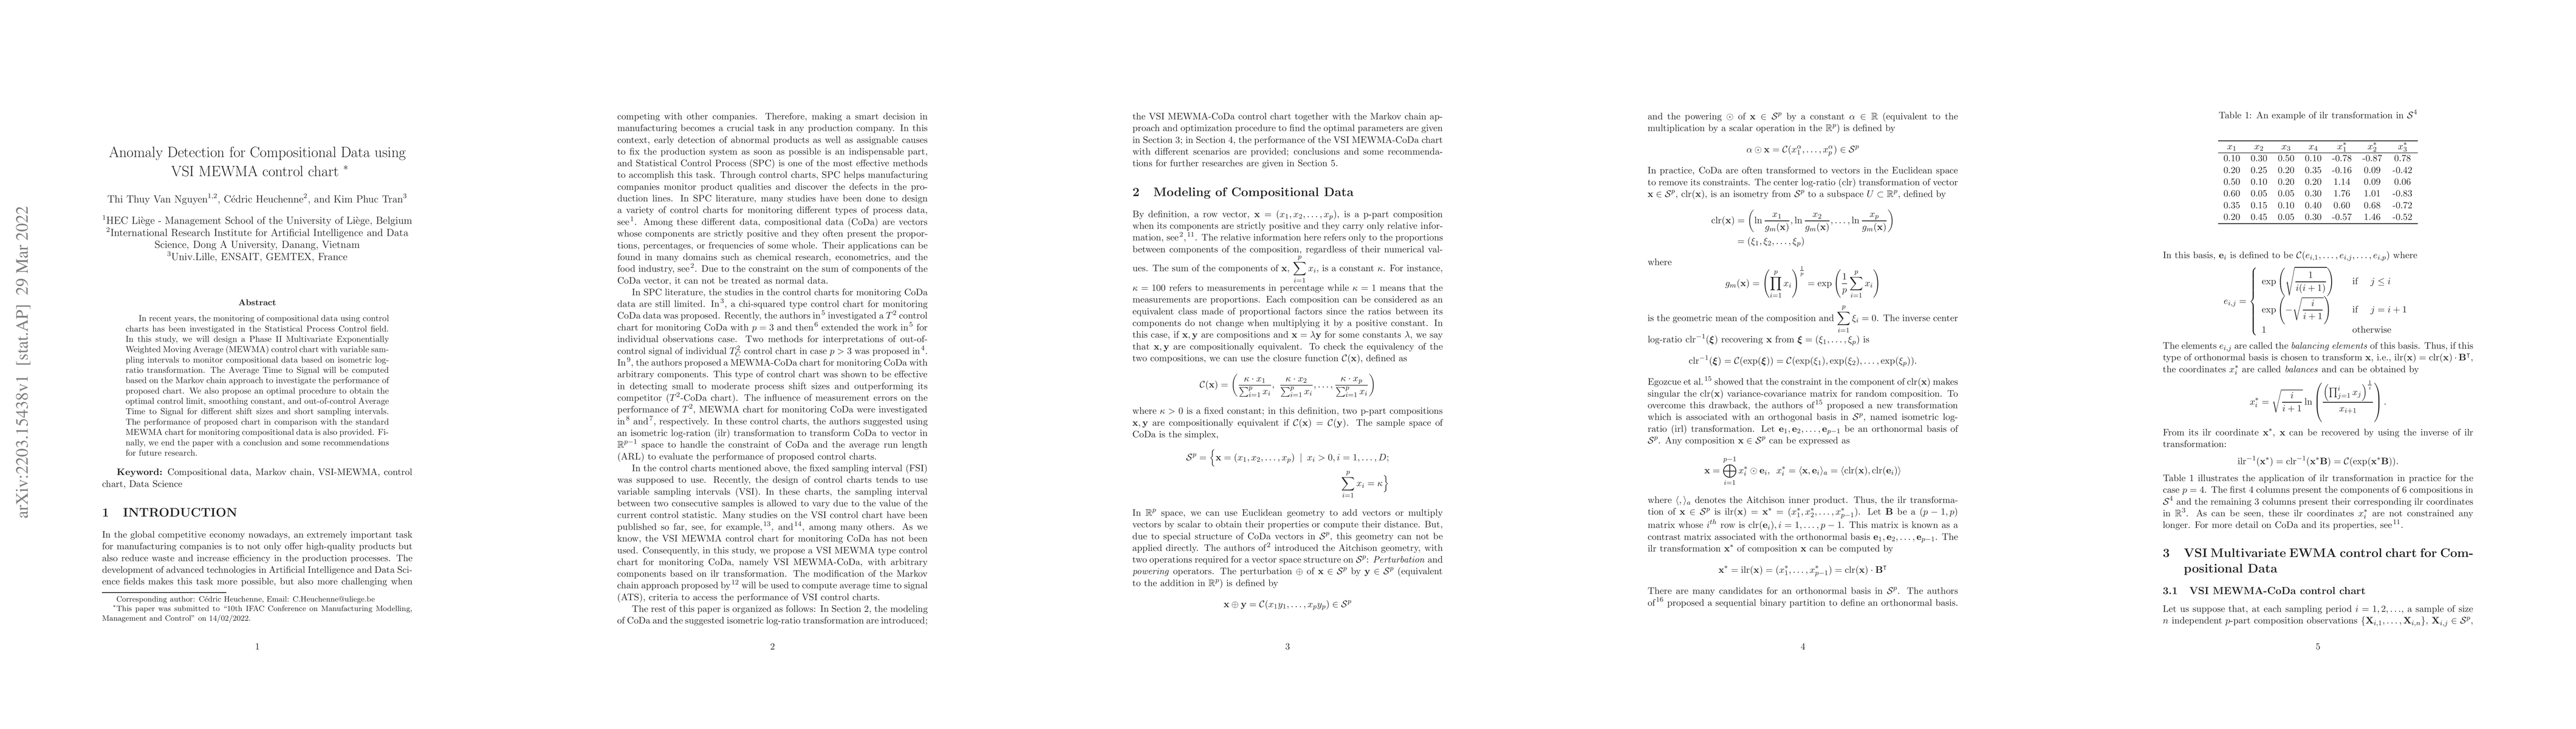
In recent years, the monitoring of compositional data using control charts has been investigated in the Statistical Process Control field. In this study, we will design a Phase II Multivariate Exponentially Weighted Moving Average (MEWMA) control chart with variable sampling intervals to monitor compositional data based on isometric log-ratio transformation. The Average Time to Signal will be computed based on the Markov chain approach to investigate the performance of proposed chart. We also propose an optimal procedure to obtain the optimal control limit, smoothing constant, and out-of-control Average Time to Signal for different shift sizes and short sampling intervals. The performance of proposed chart in comparison with the standard MEWMA chart for monitoring compositional data is also provided. Finally, we end the paper with a conclusion and some recommendations for future research.
AI Key Findings
Get AI-generated insights about this paper's methodology, results, significance, and more — seven facets brought into focus.
Impact
Paper Details
Authors
PDF Preview
Key Terms
Citation Network
Current paper (gray), citations (green), references (blue)
Display is limited for performance on very large graphs.
Discussion 0