Publication
Metrics
AI Quick Summary
This paper introduces an automated Diagram Generator (DG) to efficiently produce Feynman diagrams for calculating $n^{\text{th}}$-order nonlinear optical spectroscopies, especially when optical pulses overlap, reducing human error and computational cost. The DG is demonstrated through third-order transient absorption and fifth-order exciton-exciton interaction 2D spectroscopy, showing significant improvements in handling complex pulse overlap scenarios.
Paper Preview
Abstract
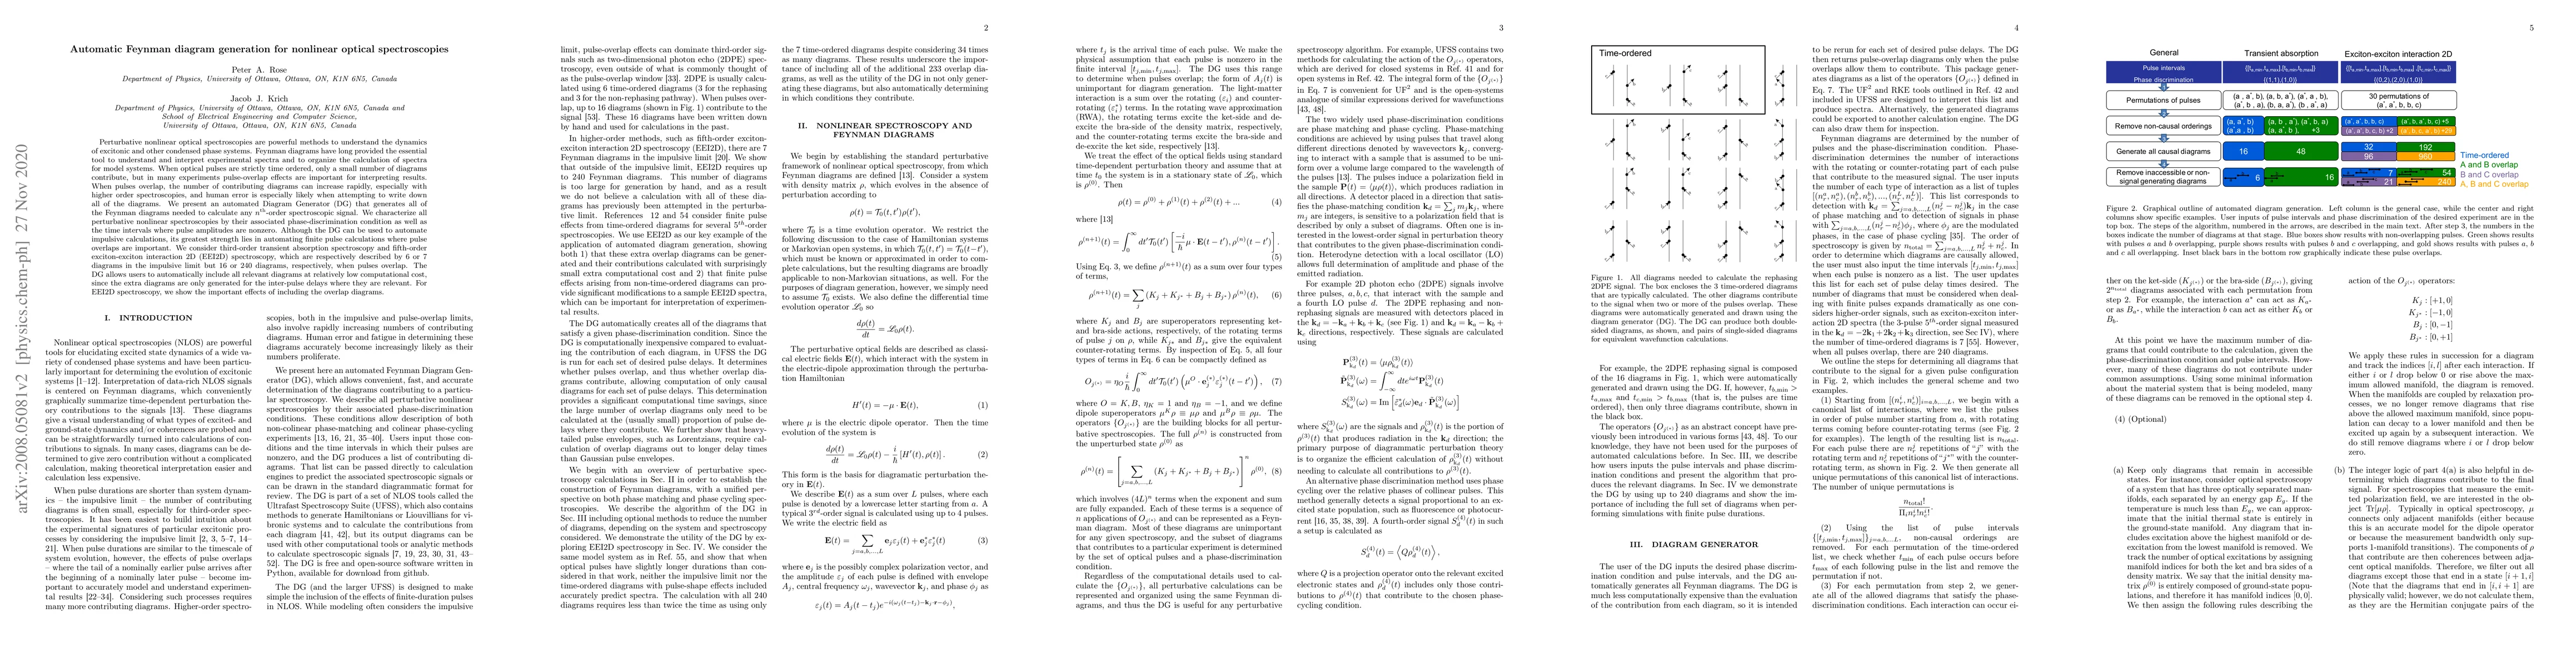
Perturbative nonlinear optical spectroscopies are powerful methods to understand the dynamics of excitonic and other condensed phase systems. Feynman diagrams have long provided the essential tool to understand and interpret experimental spectra and to organize the calculation of spectra for model systems. When optical pulses are strictly time ordered, only a small number of diagrams contribute, but in many experiments pulse-overlap effects are important for interpreting results. When pulses overlap, the number of contributing diagrams can increase rapidly, especially with higher order spectroscopies, and human error is especially likely when attempting to write down all of the diagrams. We present an automated Diagram Generator (DG) that generates all of the Feynman diagrams needed to calculate any $n^{\text{th}}$-order spectroscopic signal. We characterize all perturbative nonlinear spectroscopies by their associated phase-discrimination condition as well as the time intervals where pulse amplitudes are nonzero. Although the DG can be used to automate impulsive calculations, its greatest strength lies in automating finite pulse calculations where pulse overlaps are important. We consider third-order transient absorption spectroscopy and fifth-order exciton-exciton interaction 2D (EEI2D) spectroscopy, which are respectively described by 6 or 7 diagrams in the impulsive limit but 16 or 240 diagrams, respectively, when pulses overlap. The DG allows users to automatically include all relevant diagrams at relatively low computational cost, since the extra diagrams are only generated for the inter-pulse delays where they are relevant. For EEI2D spectroscopy, we show the important effects of including the overlap diagrams.
AI Key Findings
Get AI-generated insights about this paper's methodology, results, significance, and more — seven facets brought into focus.
Impact
Paper Details
PDF Preview
Key Terms
Citation Network
Current paper (gray), citations (green), references (blue)
Display is limited for performance on very large graphs.
Discussion 0