Automatically layout and visualize the biological pathway map with spectral graph theory
Publication
Metrics
Paper Preview
Abstract
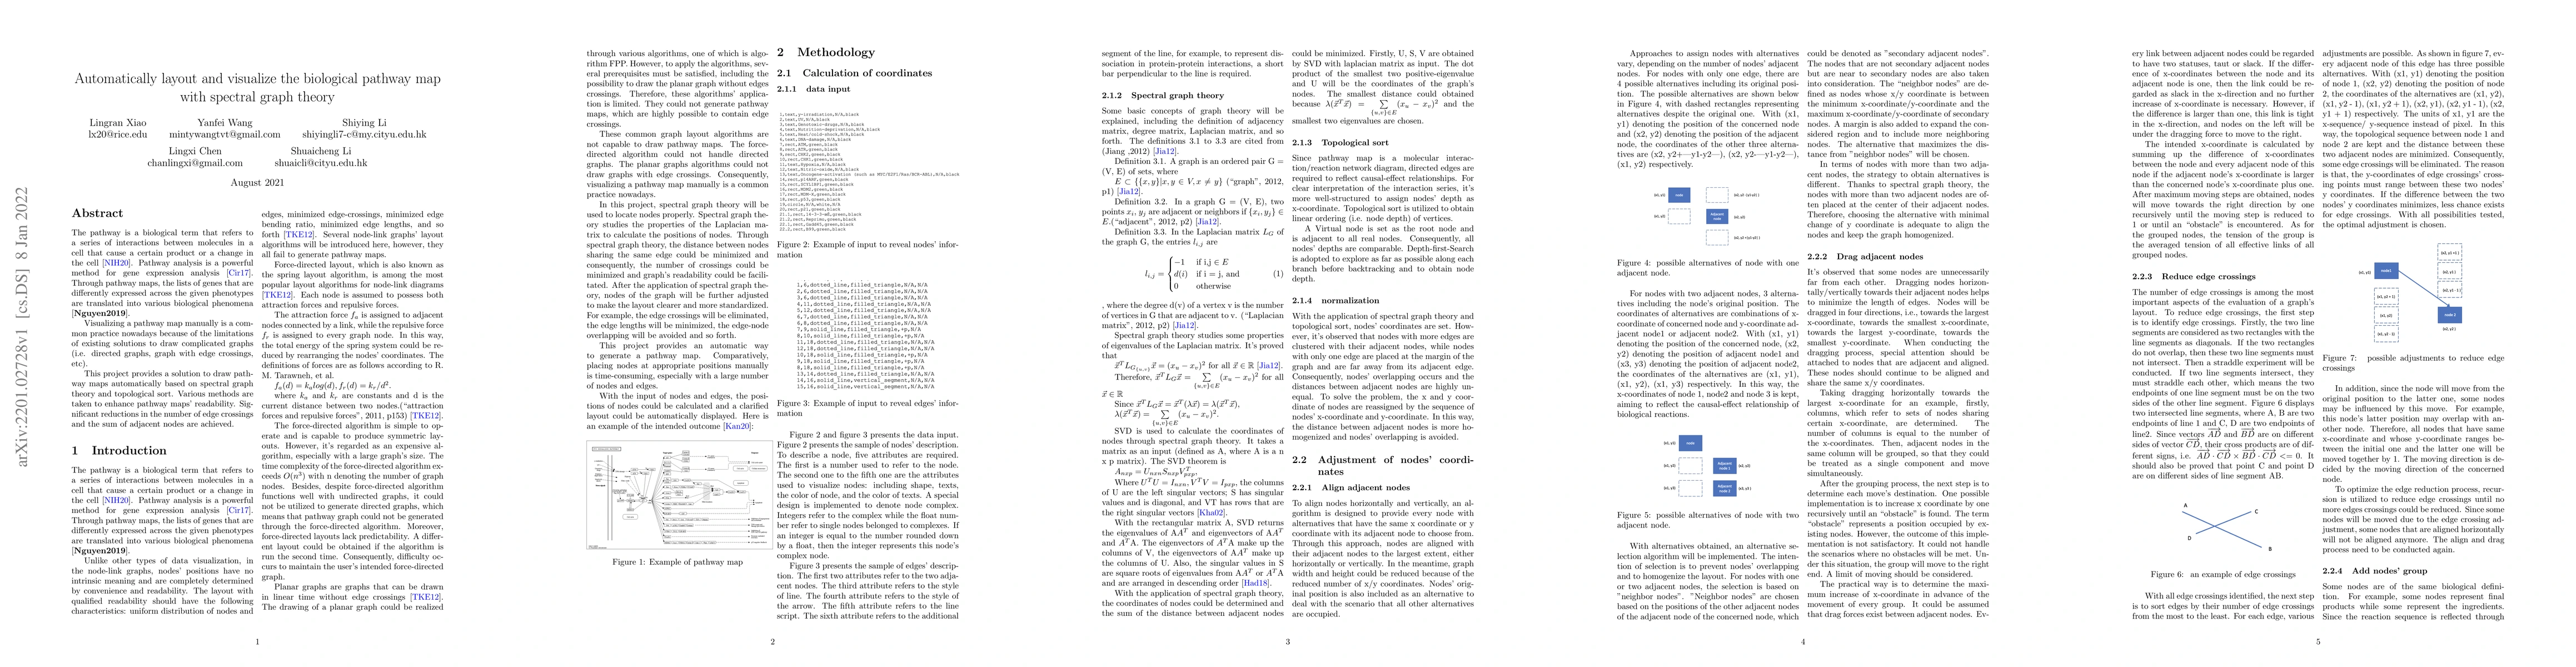
The pathway is a biological term that refers to a series of interactions between molecules in a cell that causes a certain product or a change in the cell. Pathway analysis is a powerful method for gene expression analysis. Through pathway maps, the lists of genes that are differentially expressed across the given phenotypes are translated into various biological phenomena. Visualizing a pathway map manually is a common practice nowadays because of the limitations of existing solutions to draw complicated graphs (i.e. directed graphs, graphs with edge crossings, etc). This project provides a solution to draw pathway maps automatically based on spectral graph theory and topological sort. Various methods are taken to enhance pathway maps' readability. Significant reductions in the number of edge crossings and the sum of adjacent nodes are achieved.
AI Key Findings
Get AI-generated insights about this paper's methodology, results, significance, and more — seven facets brought into focus.
Impact
Paper Details
Authors
PDF Preview
Key Terms
Citation Network
Current paper (gray), citations (green), references (blue)
Display is limited for performance on very large graphs.
Discussion 0