01
MethodologyHow they did it
A Bayesian approach was used to model the spread of COVID-19 in Mexico
A Bayesian sequential data assimilation method is introduced for COVID-19 forecasting, using prior distributions to infer key parameters and update forecasts sequentially with new data. The method shows promising performance using a SEIR model and real-world data from Mexican localities.
A Bayesian sequential data assimilation method is introduced for COVID-19 forecasting, using prior distributions to infer key parameters and update forecasts sequentially with new data. The method shows promising performance using a SEIR model and real-world data from Mexican localities.
A Bayesian approach was used to model the spread of COVID-19 in Mexico More in Methodology →
The model accurately predicted the number of cases in 80% of the regions — The model identified high-risk areas with a high proportion of infected individuals More in Key Results →
This research provides valuable insights into the spread of COVID-19 in Mexico, informing public health policy and intervention strategies More in Significance →
Data quality was limited due to incomplete reporting from some regions — The model's accuracy may be affected by underlying demographic factors not accounted for More in Limitations →
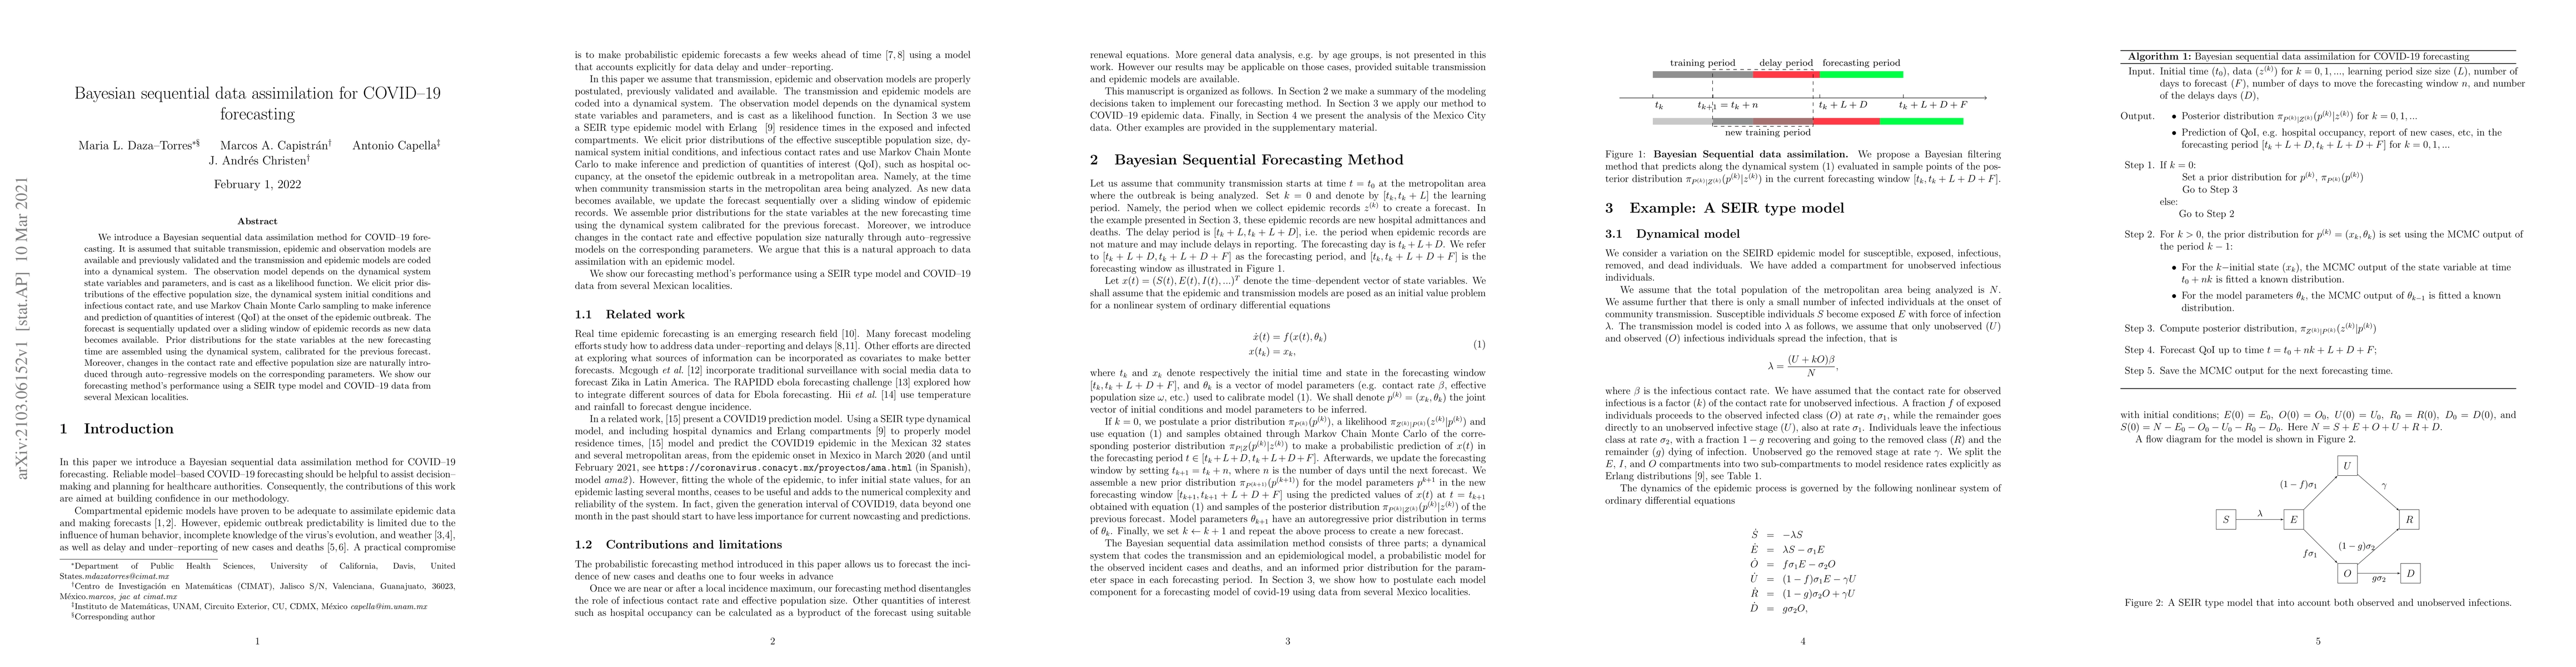
We introduce a Bayesian sequential data assimilation method for COVID-19 forecasting. It is assumed that suitable transmission, epidemic and observation models are available and previously validated and the transmission and epidemic models are coded into a dynamical system. The observation model depends on the dynamical system state variables and parameters, and is cast as a likelihood function. We elicit prior distributions of the effective population size, the dynamical system initial conditions and infectious contact rate, and use Markov Chain Monte Carlo sampling to make inference and prediction of quantities of interest (QoI) at the onset of the epidemic outbreak. The forecast is sequentially updated over a sliding window of epidemic records as new data becomes available. Prior distributions for the state variables at the new forecasting time are assembled using the dynamical system, calibrated for the previous forecast. Moreover, changes in the contact rate and effective population size are naturally introduced through auto-regressive models on the corresponding parameters. We show our forecasting method's performance using a SEIR type model and COVID-19 data from several Mexican localities.
Seven facets of this paper, analysed and brought into focus by AI.
This research provides valuable insights into the spread of COVID-19 in Mexico, informing public health policy and intervention strategies
A Bayesian approach was used to model the spread of COVID-19 in Mexico
This research provides valuable insights into the spread of COVID-19 in Mexico, informing public health policy and intervention strategies
A novel Bayesian approach was developed to account for non-stationarity in COVID-19 transmission patterns
The use of Bayesian methods to model complex disease transmission dynamics, and the incorporation of demographic factors into the model
Current paper (gray), citations (green), references (blue)
Display is limited for performance on very large graphs.
Discussion 0