BickGraphing: Web-Based Application for Visual Inspection of Audio Recordings
Publication
Metrics
Paper Preview
Abstract
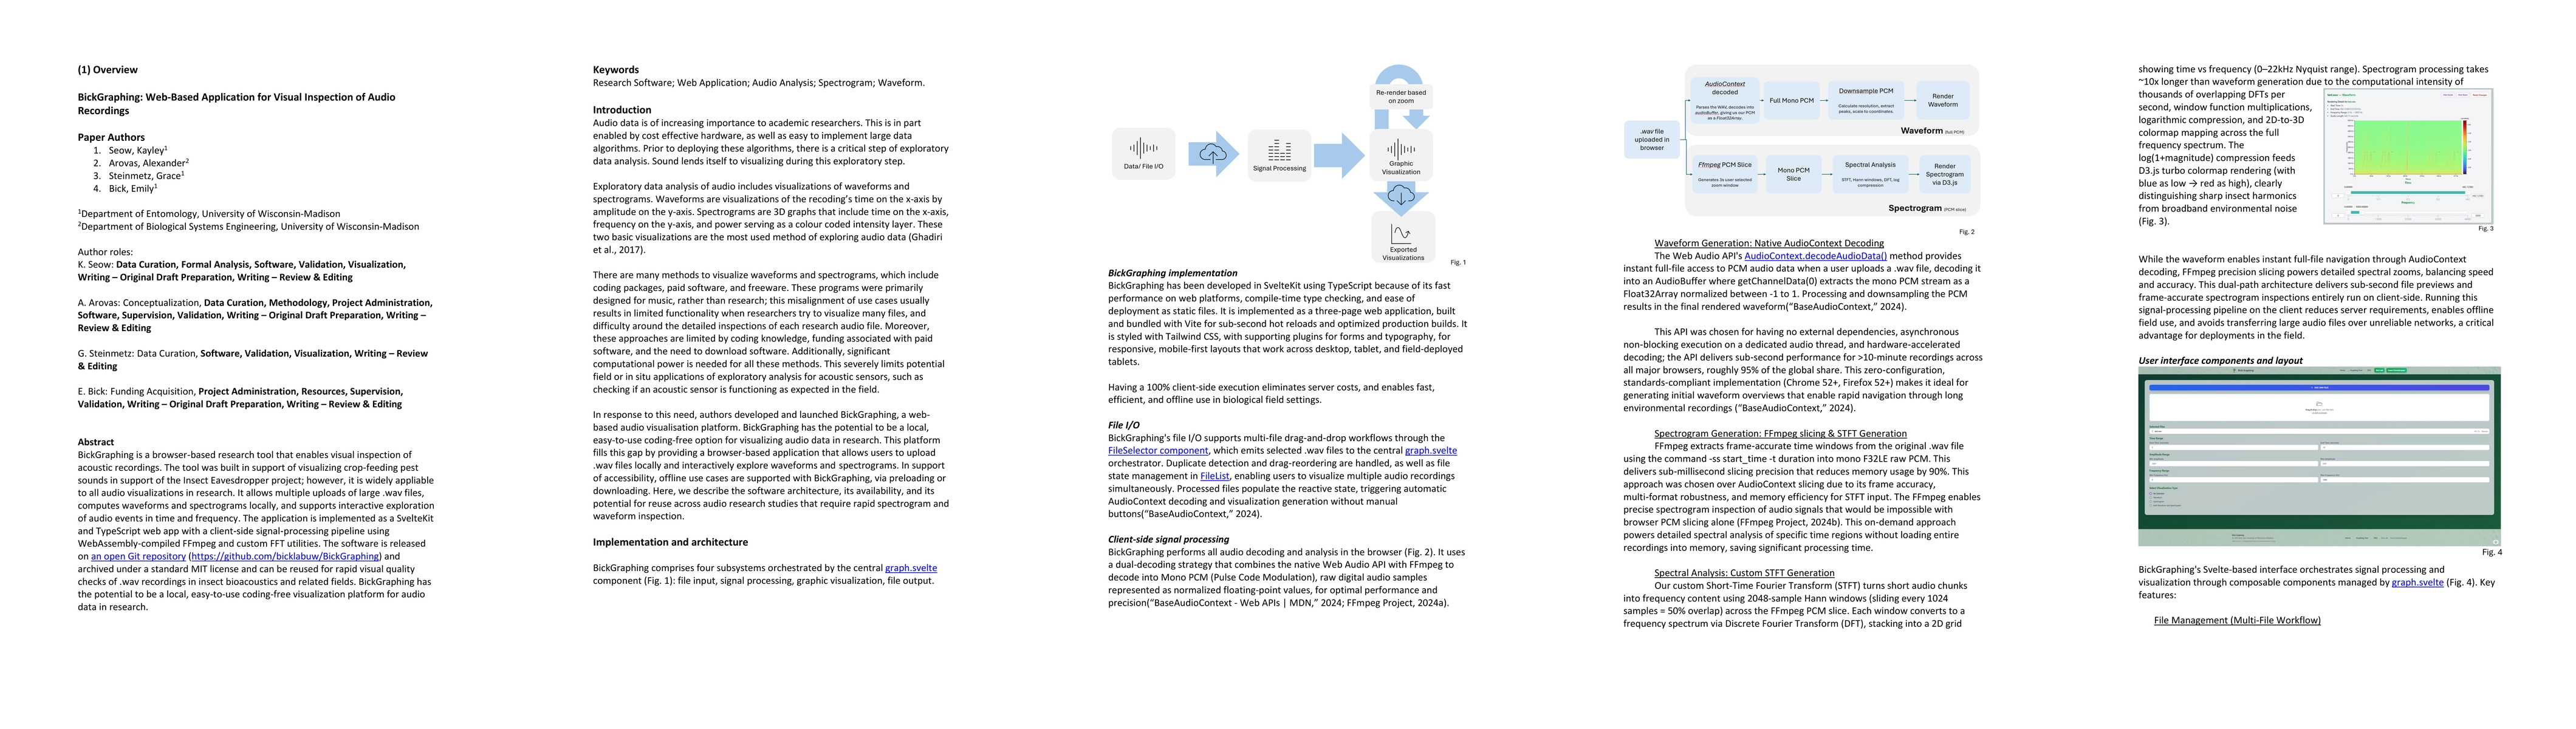
BickGraphing is a browser based research tool that enables visual inspection of acoustic recordings. The tool was built in support of visualizing crop feeding pest sounds in support of the Insect Eavesdropper project; however, it is widely applicable to all audiovisualizations in research. It allows multiple uploads of large .wav files, computes waveforms and spectrograms locally, and supports interactive exploration of audio events in time and frequency. The application is implemented as a SvelteKit and TypeScript web app with a client side signal processing pipeline using WebAssembly compiled FFmpeg and custom FFT utilities. The software is released on an open Git repository (https://github.com/bicklabuw/BickGraphing) and archived under a standard MIT license and can be reused for rapid visual quality checks of .wav recordings in insect bioacoustics and related fields. BickGraphing has the potential to be a local, easy to use coding free visualization platform for audio data in research.
AI Key Findings
Get AI-generated insights about this paper's methodology, results, significance, and more — seven facets brought into focus.
Discussion 0