AI Quick Summary
Blue Noise Plots are two-dimensional dot plots designed to reduce visual clutter in univariate data representation by optimizing dot placement to maintain minimum distance, avoiding false clusters and overlap. The effectiveness and aesthetics of these plots were evaluated through a quantitative and qualitative user study.
Quick Answers
What is "Blue Noise Plots" about?
Blue Noise Plots are two-dimensional dot plots designed to reduce visual clutter in univariate data representation by optimizing dot placement to maintain minimum distance, avoiding false clusters and overlap. The effectiveness and aesthetics of these plots were evaluated through a quantitative and qualitative user study.
What methodology did the authors use?
The research introduces Blue Noise Plots, a two-dimensional dot plot method for univariate datasets, which optimizes dot positions to maintain a minimum distance in 2D, unlike jitter plots that use randomness. The method combines Lloyd relaxation with a Voronoi diagram approach, ensuring dots are distributed while adhering to blue noise principles. More in Methodology →
What are the key results?
Blue Noise Plots effectively reduce visual clutter and overlap compared to jitter plots. — User studies confirm that Blue Noise Plots are visually more appealing and easier to interpret than jitter plots. More in Key Results →
Why is this work significant?
This research is significant as it improves upon jitter plots by optimizing dot placement for better visual appeal and data depiction, addressing common issues like visual clutter and misleading clusters. More in Significance →
What are the main limitations?
The method requires computational resources for optimization, which might be a limitation for very large datasets. — The automatic height selection for plots might not always yield optimal results for all datasets. More in Limitations →
Paper Preview
Abstract
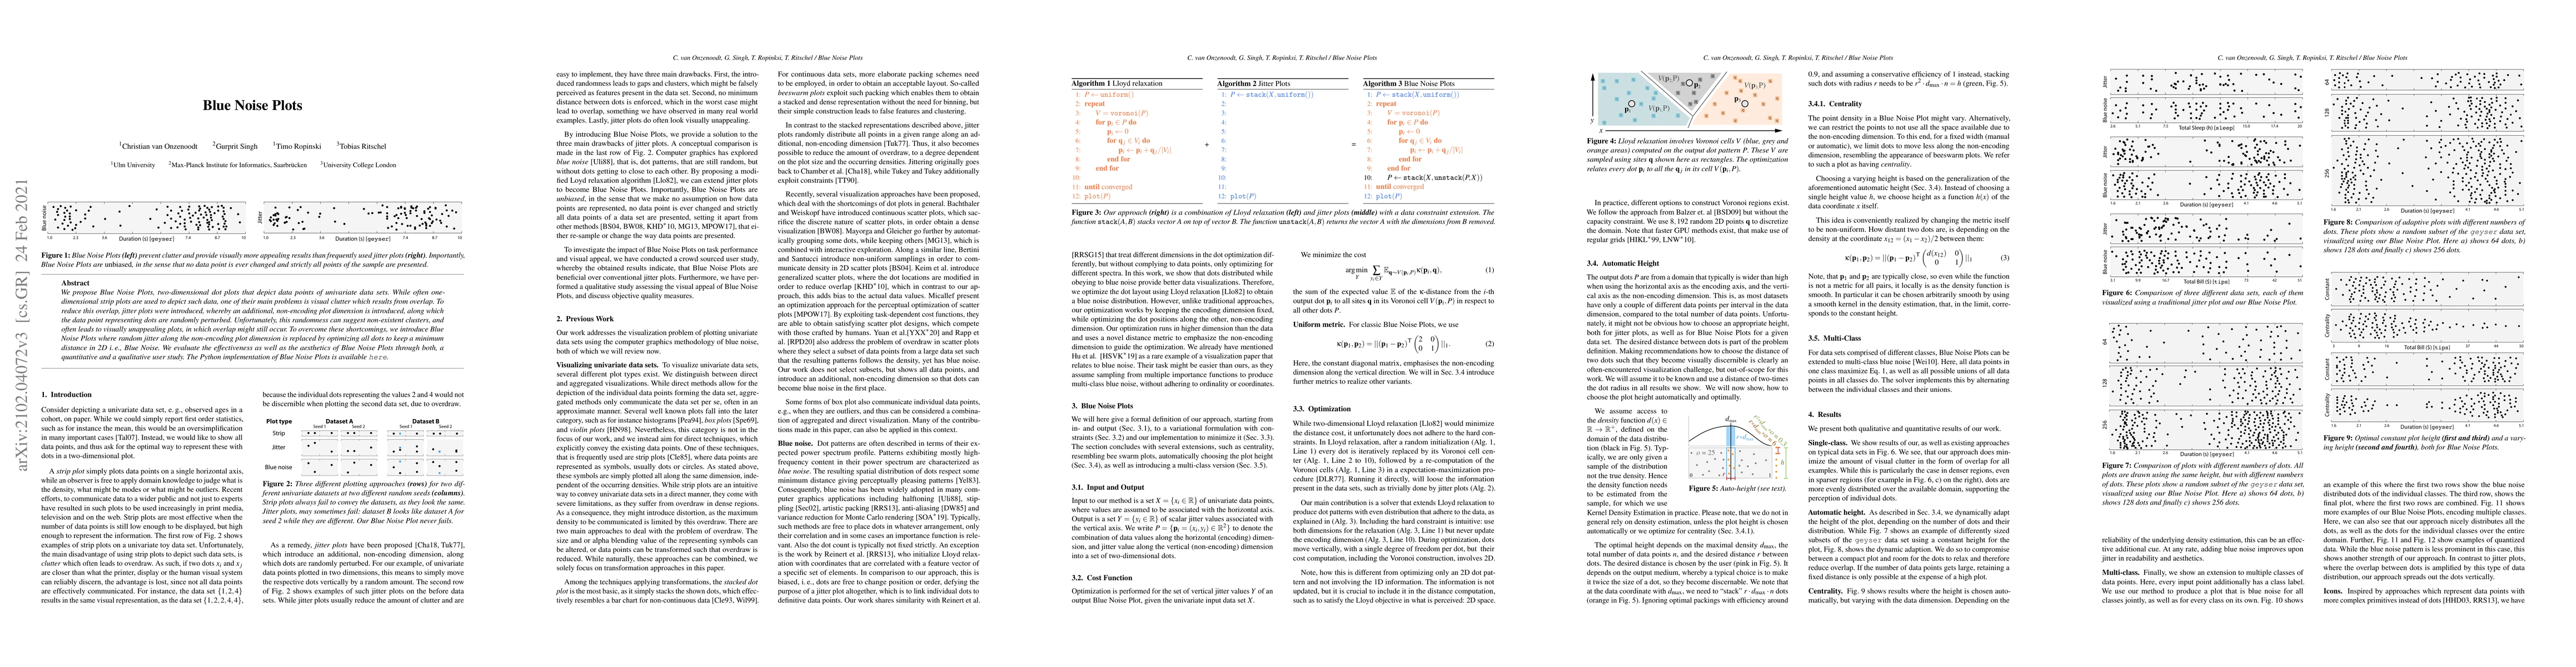
We propose Blue Noise Plots, two-dimensional dot plots that depict data points of univariate data sets. While often one-dimensional strip plots are used to depict such data, one of their main problems is visual clutter which results from overlap. To reduce this overlap, jitter plots were introduced, whereby an additional, non-encoding plot dimension is introduced, along which the data point representing dots are randomly perturbed. Unfortunately, this randomness can suggest non-existent clusters, and often leads to visually unappealing plots, in which overlap might still occur. To overcome these shortcomings, we introduce BlueNoise Plots where random jitter along the non-encoding plot dimension is replaced by optimizing all dots to keep a minimum distance in 2D i. e., Blue Noise. We evaluate the effectiveness as well as the aesthetics of Blue Noise Plots through both, a quantitative and a qualitative user study. The Python implementation of Blue Noise Plots is available here.
AI Key Findings
Generated Sep 03, 2025
Methodology — What approach did the authors take?
The research introduces Blue Noise Plots, a two-dimensional dot plot method for univariate datasets, which optimizes dot positions to maintain a minimum distance in 2D, unlike jitter plots that use randomness. The method combines Lloyd relaxation with a Voronoi diagram approach, ensuring dots are distributed while adhering to blue noise principles.
Key Results — What are the main findings?
- Blue Noise Plots effectively reduce visual clutter and overlap compared to jitter plots.
- User studies confirm that Blue Noise Plots are visually more appealing and easier to interpret than jitter plots.
- The method enables more accurate estimation of univariate datasets' underlying distribution compared to jitter plots.
- The approach is adaptable for higher-dimensional visualizations and can incorporate extended primitives like icons instead of dots.
Significance — Why does this research matter?
This research is significant as it improves upon jitter plots by optimizing dot placement for better visual appeal and data depiction, addressing common issues like visual clutter and misleading clusters.
Technical Contribution — What is the technical contribution?
The main technical contribution is the Blue Noise Plots algorithm, which uses Lloyd relaxation with a Voronoi diagram to optimize dot positions while maintaining a blue noise distribution, ensuring minimal overlap and better visual clarity.
Novelty — What is new about this work?
The novelty of this work lies in reformulating the randomization of jitter plots into an optimization procedure, enforcing data constraints to achieve improved visual appeal and data depiction in 2D visualizations.
Limitations — What are the limitations of this study?
- The method requires computational resources for optimization, which might be a limitation for very large datasets.
- The automatic height selection for plots might not always yield optimal results for all datasets.
Future Work — What did the authors propose for future work?
- Investigate optimization approaches to achieve unbiased point sets with even higher spectral quality.
- Explore the impact of Blue Noise Plots on various data presentation aspects, such as size, color, icons, or animations, to enhance visualization efficiency.
Paper Details
How to Cite This Paper
@article{onzenoodt2021blue,
  title         = {Blue Noise Plots},
  author        = {Onzenoodt, Christian van and Singh, Gurprit and Ropinski, Timo and others},
  year          = {2021},
  eprint        = {2102.04072},
  archivePrefix = {arXiv},
  primaryClass  = {cs.GR},
}Onzenoodt, C., Singh, G., Ropinski, T., & Ritschel, T. (2021). Blue Noise Plots. arXiv. https://arxiv.org/abs/2102.04072Onzenoodt, Christian van, et al. "Blue Noise Plots." arXiv, 2021, arxiv.org/abs/2102.04072.PDF Preview
Key Terms
Citation Network
Current paper (gray), citations (green), references (blue)
Display is limited for performance on very large graphs.
Similar Papers
Found 4 papersBlue noise for diffusion models
Xingchang Huang, Corentin Salaün, Cristina Vasconcelos et al.
Scalar Spatiotemporal Blue Noise Masks
Alan Wolfe, Ravi Ramamoorthi, Nathan Morrical et al.
| Title | Authors | Year | Actions |
|---|
Comments (0)