01
MethodologyHow they did it
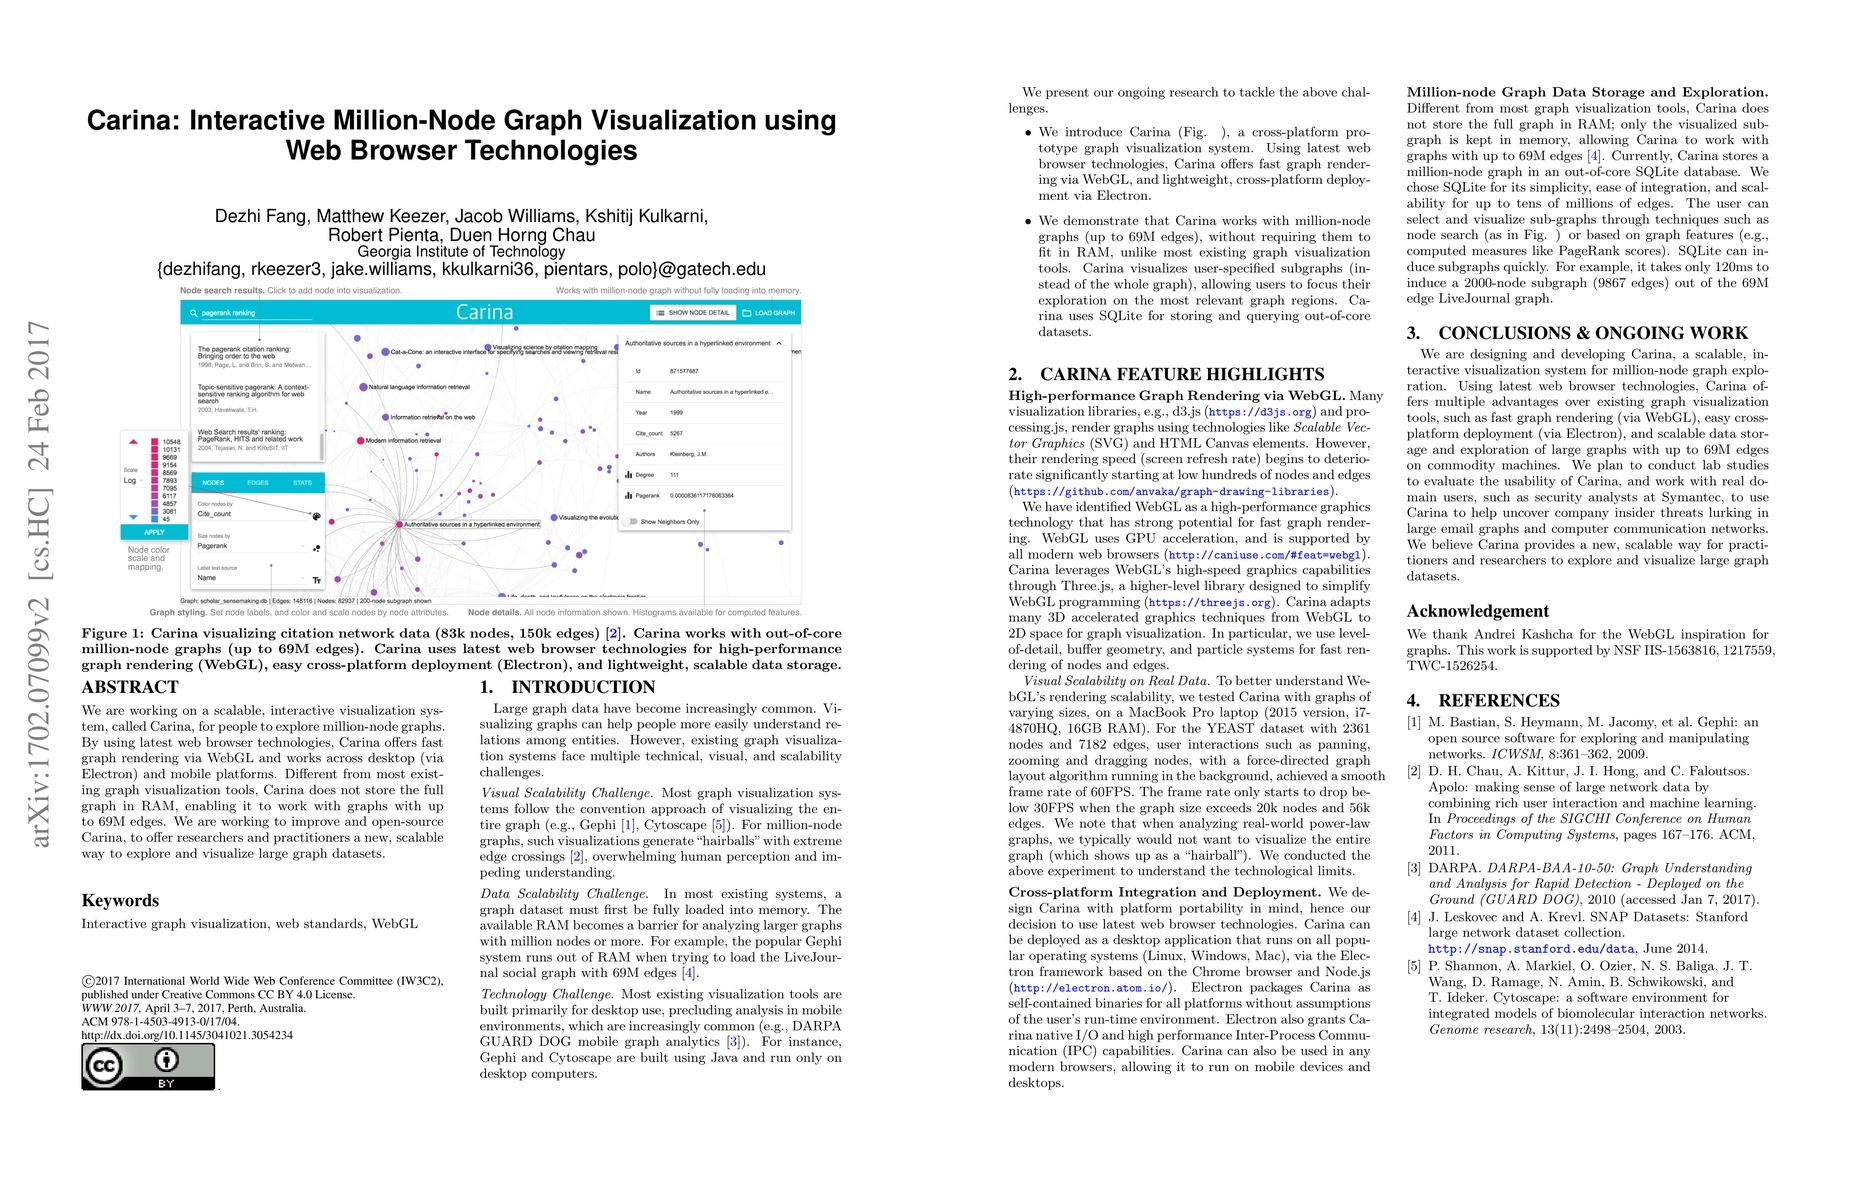
The research introduces Carina, a cross-platform prototype graph visualization system using the latest web browser technologies, including WebGL for high-performance rendering and Electron for cross-platform deployment.
Discussion 0