Categorizing Flight Paths using Data Visualization and Clustering Methodologies
Publication
Metrics
AI Quick Summary
This paper categorizes air traffic using clustering algorithms applied to FAA data, employing spatial and vector-based models. The study finds geographic distance models more effective for enroute paths, while cosine similarity models excel in near-terminal operations, with both showing successful clustering outcomes.
Paper Preview
Abstract
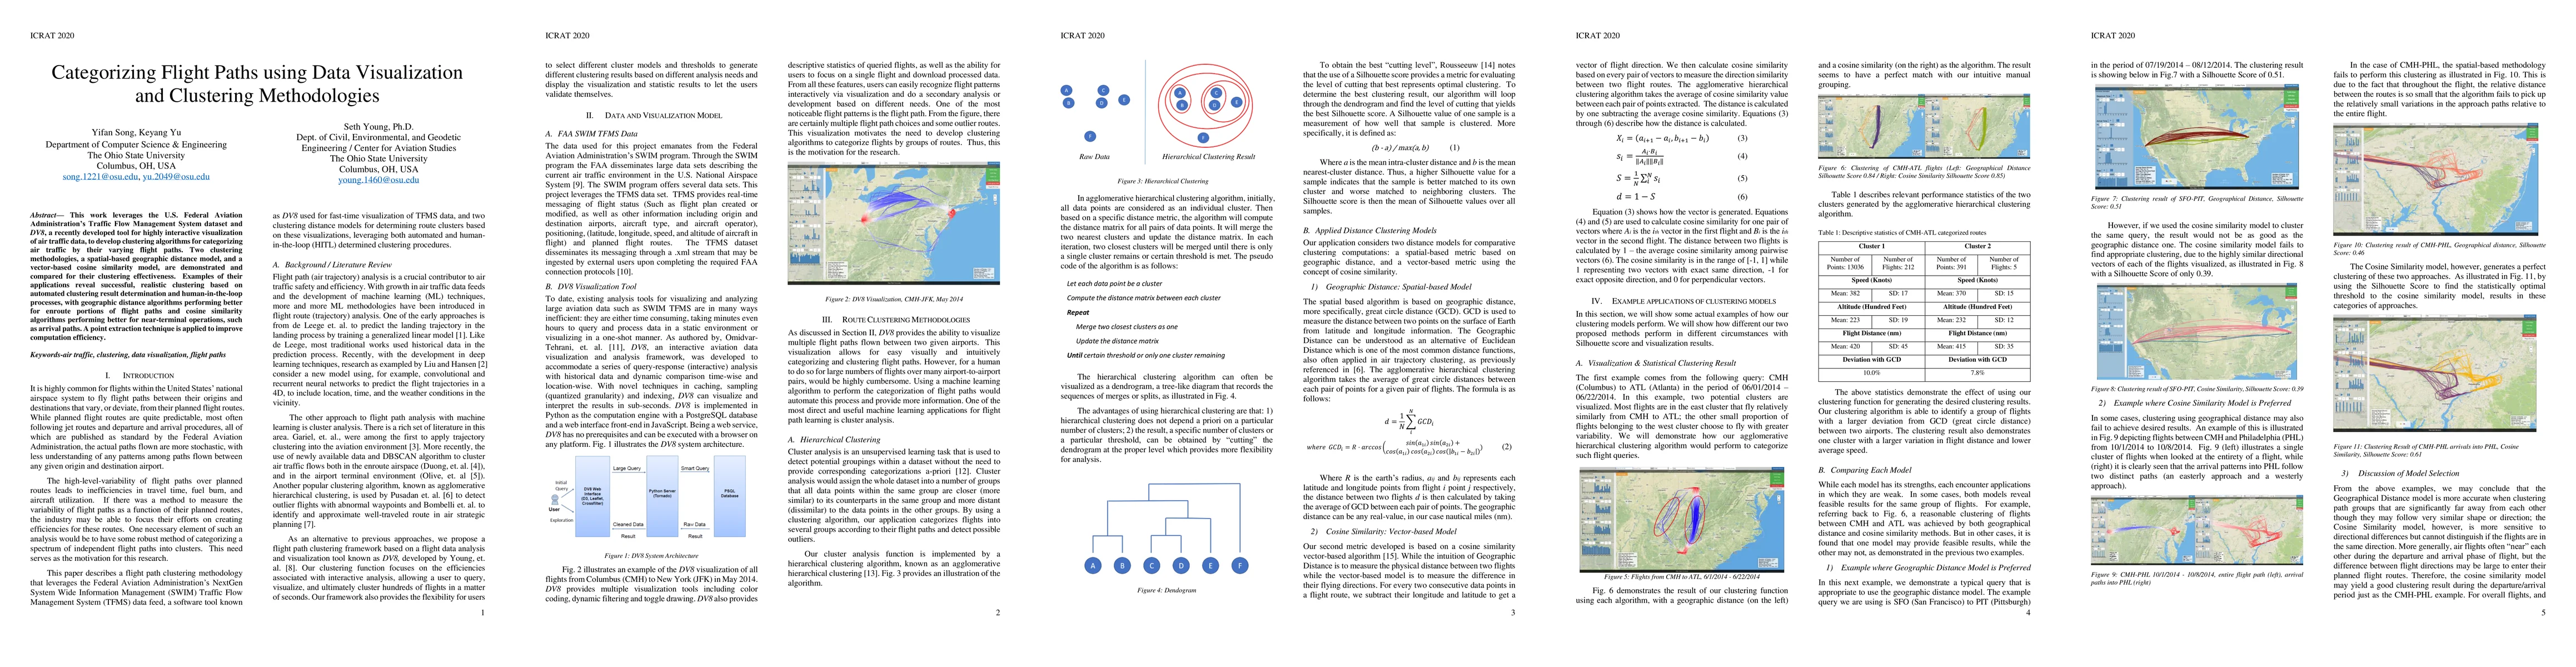
This work leverages the U.S. Federal Aviation Administration's Traffic Flow Management System dataset and DV8, a recently developed tool for highly interactive visualization of air traffic data, to develop clustering algorithms for categorizing air traffic by their varying flight paths. Two clustering methodologies, a spatial-based geographic distance model, and a vector-based cosine similarity model, are demonstrated and compared for their clustering effectiveness. Examples of their applications reveal successful, realistic clustering based on automated clustering result determination and human-in-the-loop processes, with geographic distance algorithms performing better for enroute portions of flight paths and cosine similarity algorithms performing better for near-terminal operations, such as arrival paths. A point extraction technique is applied to improve computation efficiency.
AI Key Findings
Get AI-generated insights about this paper's methodology, results, significance, and more — seven facets brought into focus.
Impact
Paper Details
Authors
PDF Preview
Key Terms
Citation Network
Current paper (gray), citations (green), references (blue)
Display is limited for performance on very large graphs.
Discussion 0