Background
Chart understanding is a central task in data literacy, where charts encode dense information about data values and structures. Prior work in chart-related AI often treats charts as natural images and translates them to natural language descriptions, which can lose essential details and efficiency for downstream tasks. By contrast, parsing a chart into code offers a lossless representation that preserves all critical information and enables precise programmatic manipulation. While several chart-focused datasets and models exist, a gap remains: current open-source MLLMs struggle to generate correct and executable code from charts, particularly when facing diverse chart types and complex data. Moreover, there is a scarcity of large-scale, high-quality chart-to-code data to support supervised tuning, hindering effective training of specialized chart-to-code models.
Problem / Research Question
The central issues addressed are: (i) how to build an LLM-based system that reliably converts charts into executable code without information loss, and (ii) how to scale training data and improve the reasoning process to handle 27 chart types with high fidelity. The key research question is whether a chart-to-code specialized MLLM, trained with a large-scale dataset and a reasoning-oriented generation strategy, can outperform existing open-source MLLMs on chart-to-code benchmarks while using a modest parameter budget.
Innovation / Contribution
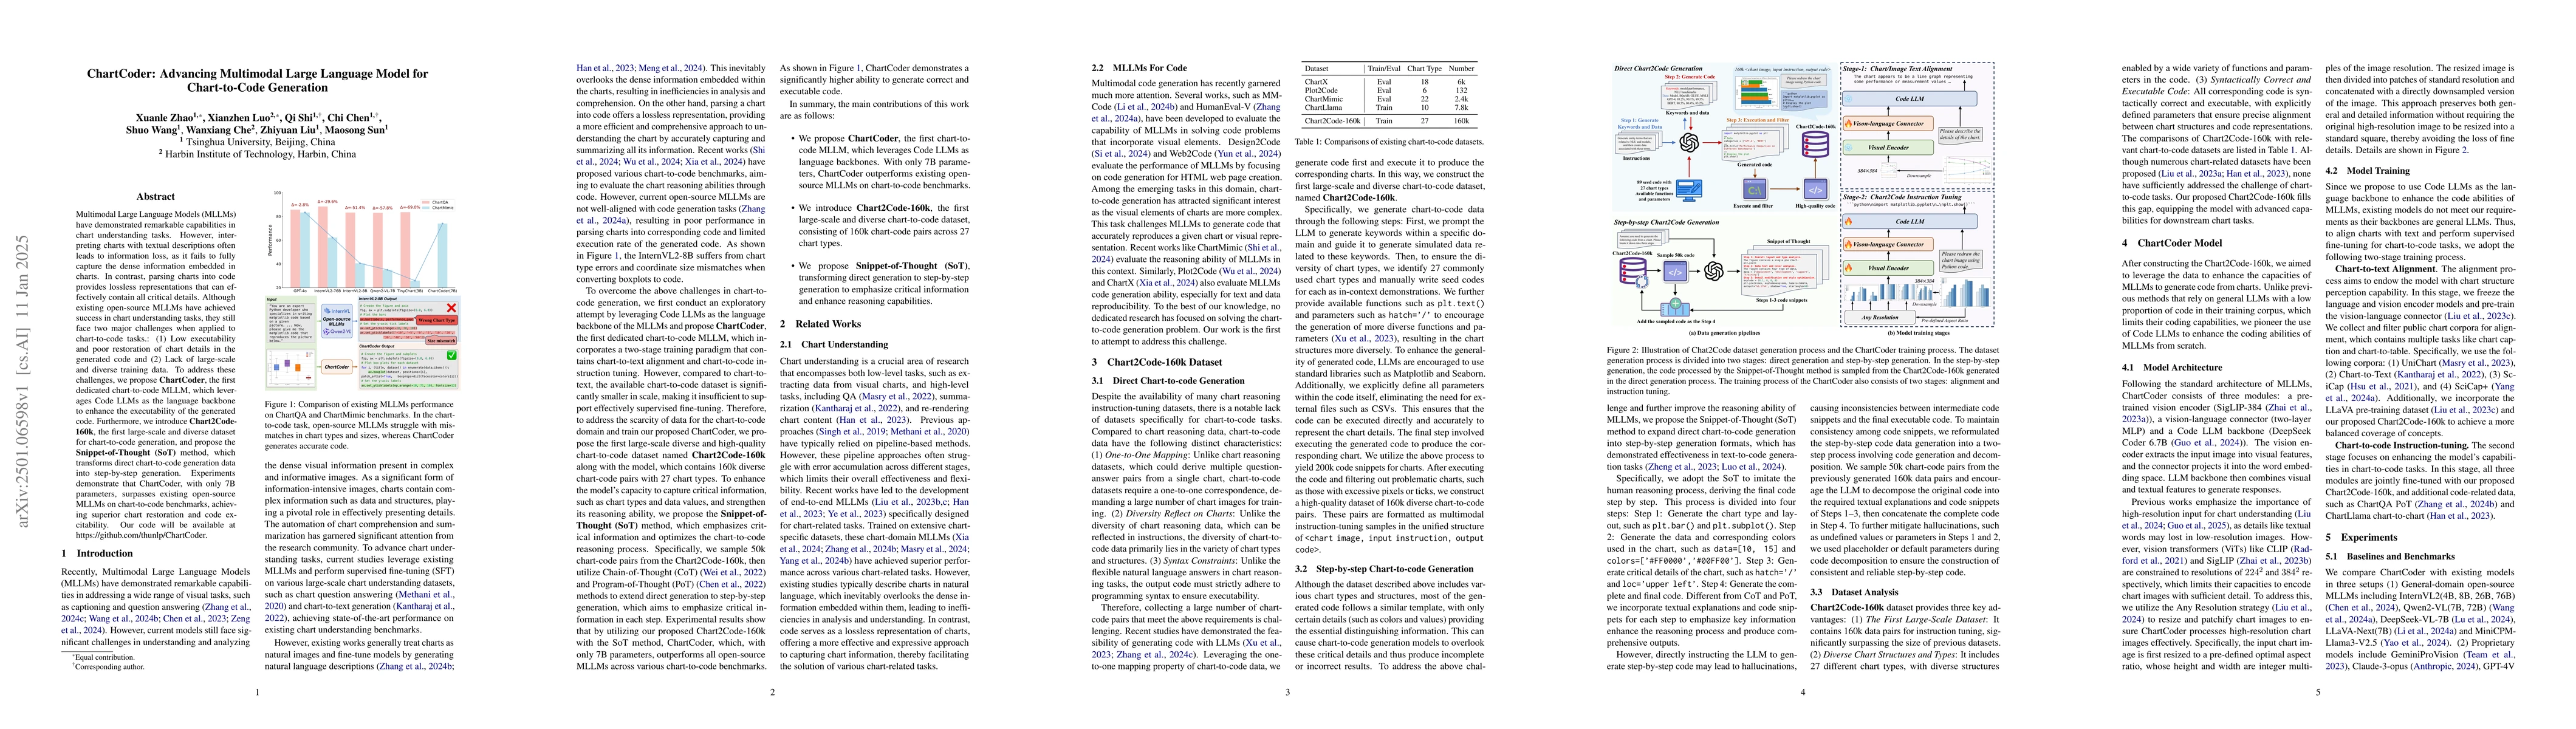
The paper introduces ChartCoder, the first dedicated chart-to-code MLLM that leverages Code LLMs as the backbone to boost code executability. It also presents Chart2Code-160k, the first large-scale and diverse dataset for chart-to-code generation, covering 27 chart types. Finally, it proposes Snippet-of-Thought SoT, a method that transforms direct chart-to-code generation into step-by-step generation to emphasize critical information during reasoning. A key practical contribution is the sampling of 50k pairs from Chart2Code-160k to apply SoT via a chain-of-thought inspired strategy, enhancing the model’s ability to produce structured, comprehensible, and executable code.
Methodology / Approach
ChartCoder adopts a two-stage training paradigm. The first stage is chart-to-text alignment, aligning chart inputs with textual representations to ground the model in the mapping between visuals and descriptive language. The second stage is chart-to-code instruction tuning, where the model learns to generate code that faithfully reproduces charts. The SoT approach extends this by creating a step-by-step generation process, signaling the model to articulate intermediate reasoning steps that capture critical information about chart types and data values. The dataset Chart2Code-160k provides 160k chart-code pairs across 27 types, with 50k pairs used for SoT-based reasoning augmentation. The model used is a 7B-parameter ChartCoder, designed to maximize code fidelity and executability while remaining computationally tractable.
Experiments / Evaluation
Evaluation focuses on chart-to-code benchmarks, including ChartQA and ChartMimic, where the ability to convert charts into correct and executable code is measured. ChartCoder is reported to outperform all existing open-source MLLMs in these benchmarks, with improvements in both chart restoration accuracy and code executability. Baselines identified include InternVL2-8B, which suffers from chart type errors and coordinate size mismatches when converting charts (for example, box plots) into code. The reported results demonstrate that aligning the model with Code LLM backbones and enriching it with domain-specific data and SoT-enabled reasoning yields tangible benefits in accuracy and practicality.
Key Results
ChartCoder, with 7B parameters, surpasses open-source MLLMs across a range of chart-to-code benchmarks. The combination of Chart2Code-160k data and SoT-guided reasoning leads to improved fidelity in translating charts into code and higher executability of the resulting programs. The authors highlight that ChartCoder achieves superior chart restoration and produces more executable code, addressing the core weaknesses of prior MLLMs in chart-to-code tasks.
Practical Applications
This work enables more reliable automation for chart-driven workflows, including data extraction, reproducible chart generation, and programmable analyses based on chart inputs. By delivering executable code that faithfully represents chart information, ChartCoder lowers the barrier for developers and researchers to integrate charts into dashboards, data pipelines, and computational notebooks. The dataset and model release further support researchers who aim to build domain-specific tools for chart-centric automation and analytics.
Limitations & Considerations
While ChartCoder advances chart-to-code capabilities, several considerations remain. The lineage of results is anchored to a 7B parameter model; extending to larger backbones or multilingual code generation remains to be tested. The dataset, though large and diverse, may still underrepresent rare or highly specialized chart types, edge cases, or noisy real-world charts. Generalization to unseen or synthetic charts beyond the 27 types, resilience to low-resolution or distorted charts, and cross-language code generation are open questions. Finally, the reliance on Code LLM backbones raises considerations about licensing, safety, and the reproducibility of code execution across diverse environments.
Discussion 0