01
MethodologyHow they did it
The research employed a vision-languagemodel-based approach to generate synthetic chart data and augment it with code.
The research employed a vision-languagemodel-based approach to generate synthetic chart data and augment it with code. More in Methodology →
Main finding 1: The proposed method achieved state-of-the-art performance on the chart redrawing task. — Main finding 2: The model demonstrated improved robustness to varying chart styles and data types. More in Key Results →
This research is important as it addresses a critical need in the field of multimodal data generation, with potential applications in various domains such as finance, healthcare, and education. More in Significance →
Limitation 1: The model's performance was affected by the quality of the input chart data. — Limitation 2: The augmentation strategy relied on a large corpus of code, which may not be feasible for all use cases. More in Limitations →
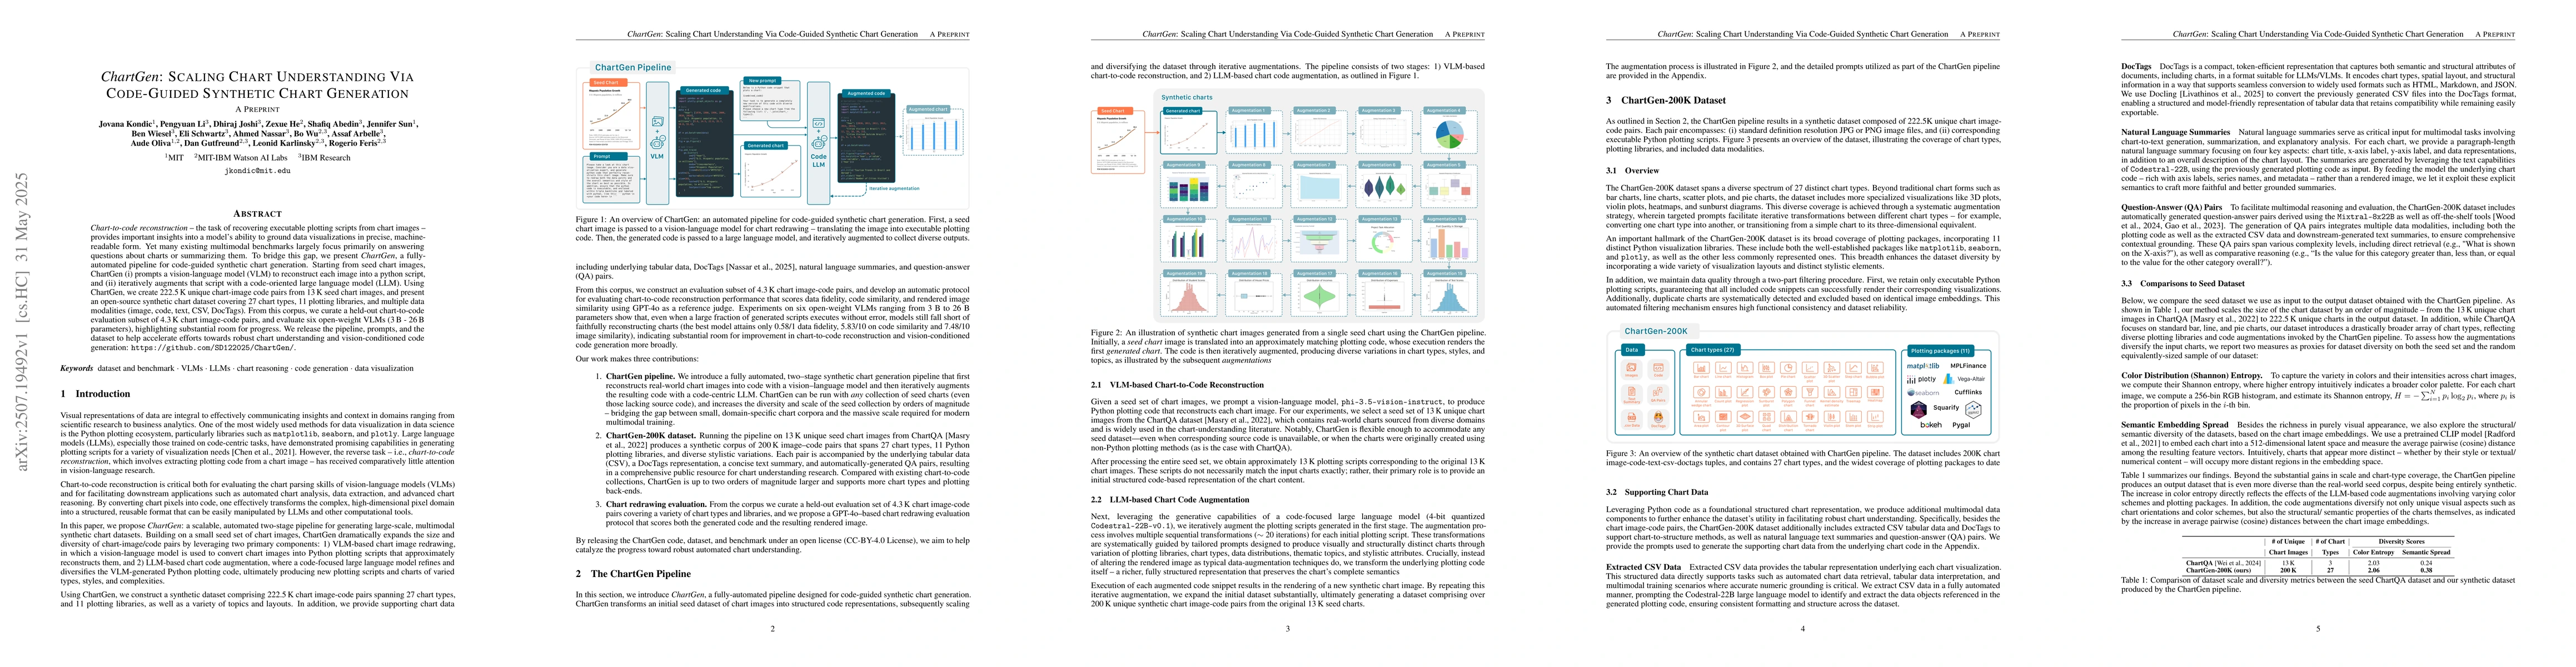
Chart-to-code reconstruction -- the task of recovering executable plotting scripts from chart images -- provides important insights into a model's ability to ground data visualizations in precise, machine-readable form. Yet many existing multimodal benchmarks largely focus primarily on answering questions about charts or summarizing them. To bridge this gap, we present ChartGen, a fully-automated pipeline for code-guided synthetic chart generation. Starting from seed chart images, ChartGen (i) prompts a vision-language model (VLM) to reconstruct each image into a python script, and (ii) iteratively augments that script with a code-oriented large language model (LLM). Using ChartGen, we create 222.5K unique chart-image code pairs from 13K seed chart images, and present an open-source synthetic chart dataset covering 27 chart types, 11 plotting libraries, and multiple data modalities (image, code, text, CSV, DocTags). From this corpus, we curate a held-out chart-to-code evaluation subset of 4.3K chart image-code pairs, and evaluate six open-weight VLMs (3B - 26B parameters), highlighting substantial room for progress. We release the pipeline, prompts, and the dataset to help accelerate efforts towards robust chart understanding and vision-conditioned code generation: https://github.com/SD122025/ChartGen/
Seven facets of this paper, analysed and brought into focus by AI.
This research is important as it addresses a critical need in the field of multimodal data generation, with potential applications in various domains such as finance, healthcare, and education.
The research employed a vision-languagemodel-based approach to generate synthetic chart data and augment it with code.
This research is important as it addresses a critical need in the field of multimodal data generation, with potential applications in various domains such as finance, healthcare, and education.
The research introduced a novel approach to generating synthetic chart data and augmenting it with code, which can be used as a building block for future multimodal data generation tasks.
This work is novel in its use of vision-languagemodels to generate synthetic chart data and augment it with code, which enables the creation of diverse and realistic charts.
Current paper (gray), citations (green), references (blue)
Display is limited for performance on very large graphs.
Discussion 0