ClassSPLOM -- A Scatterplot Matrix to Visualize Separation of Multiclass Multidimensional Data
Publication
Metrics
AI Quick Summary
ClassSPLOM is a visualization tool that helps predict labels of unseen data in multiclass classification using a scatterplot matrix metaphor. It evaluates the trustworthiness of classification results through Receiving Operating Curves.
Paper Preview
Abstract
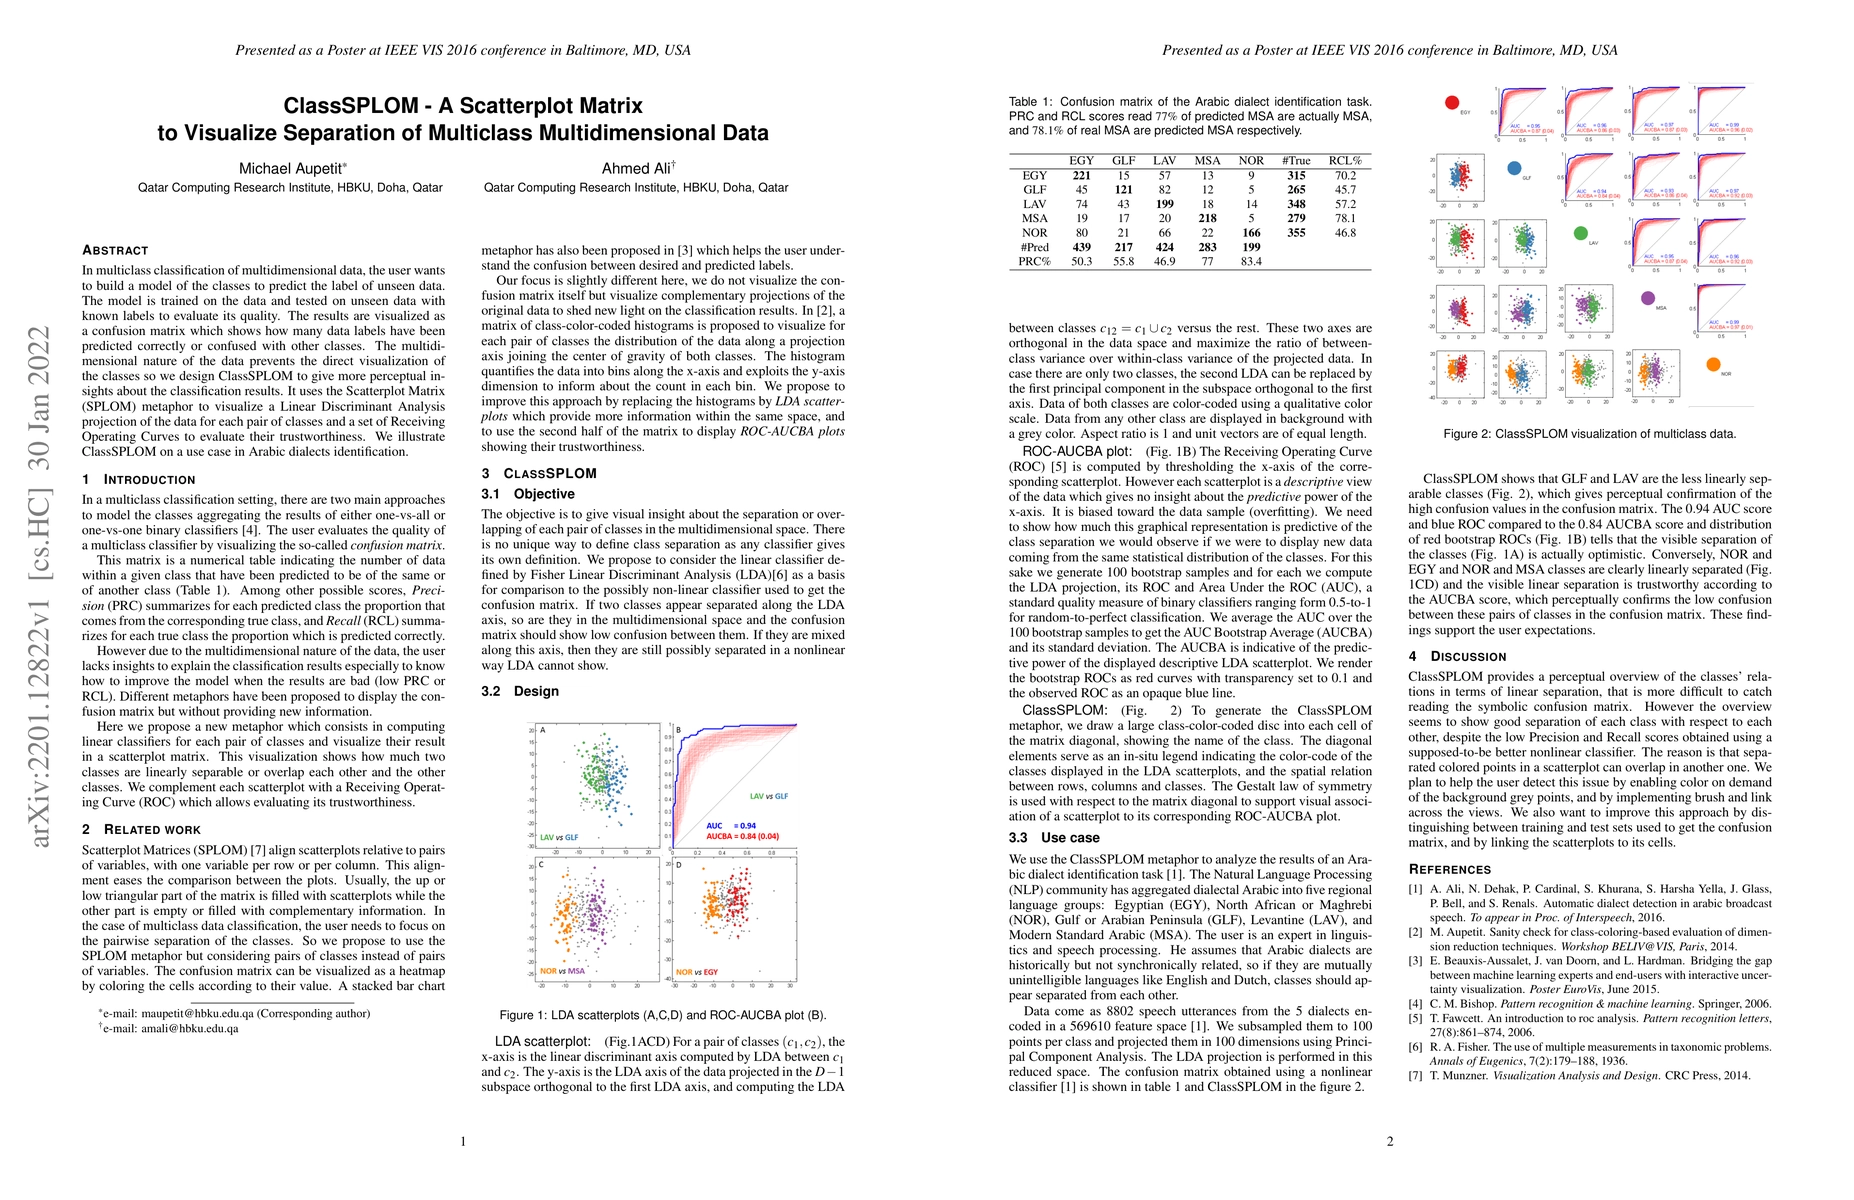
In multiclass classification of multidimensional data, the user wants to build a model of the classes to predict the label of unseen data. The model is trained on the data and tested on unseen data with known labels to evaluate its quality. The results are visualized as a confusion matrix which shows how many data labels have been predicted correctly or confused with other classes. The multidimensional nature of the data prevents the direct visualization of the classes so we design ClassSPLOM to give more perceptual insights about the classification results. It uses the Scatterplot Matrix (SPLOM) metaphor to visualize a Linear Discriminant Analysis projection of the data for each pair of classes and a set of Receiving Operating Curves to evaluate their trustworthiness. We illustrate ClassSPLOM on a use case in Arabic dialects identification.
AI Key Findings
Get AI-generated insights about this paper's methodology, results, significance, and more — seven facets brought into focus.
Impact
Paper Details
Authors
PDF Preview
Key Terms
Citation Network
Current paper (gray), citations (green), references (blue)
Display is limited for performance on very large graphs.
Discussion 0