01
MethodologyHow they did it
A combination of qualitative and quantitative methods was used to analyze the data.
Clingraph is an ASP-based visualization tool that translates ASP facts into graph visualizations using graphviz, enhancing the interface between logic programs and their visualizations. It also provides a Python API for integrating with clingo's API to monitor the solving process.
Clingraph is an ASP-based visualization tool that translates ASP facts into graph visualizations using graphviz, enhancing the interface between logic programs and their visualizations. It also provides a Python API for integrating with clingo's API to monitor the solving process.
A combination of qualitative and quantitative methods was used to analyze the data. More in Methodology →
The system was able to visualize answersets effectively — The API provided easy integration with custom projects More in Key Results →
This research is important because it provides a powerful tool for visualizing answersets in ASP systems. More in Significance →
The system was limited by the complexity of the graph visualization software — The API had some issues with compatibility with certain browsers More in Limitations →
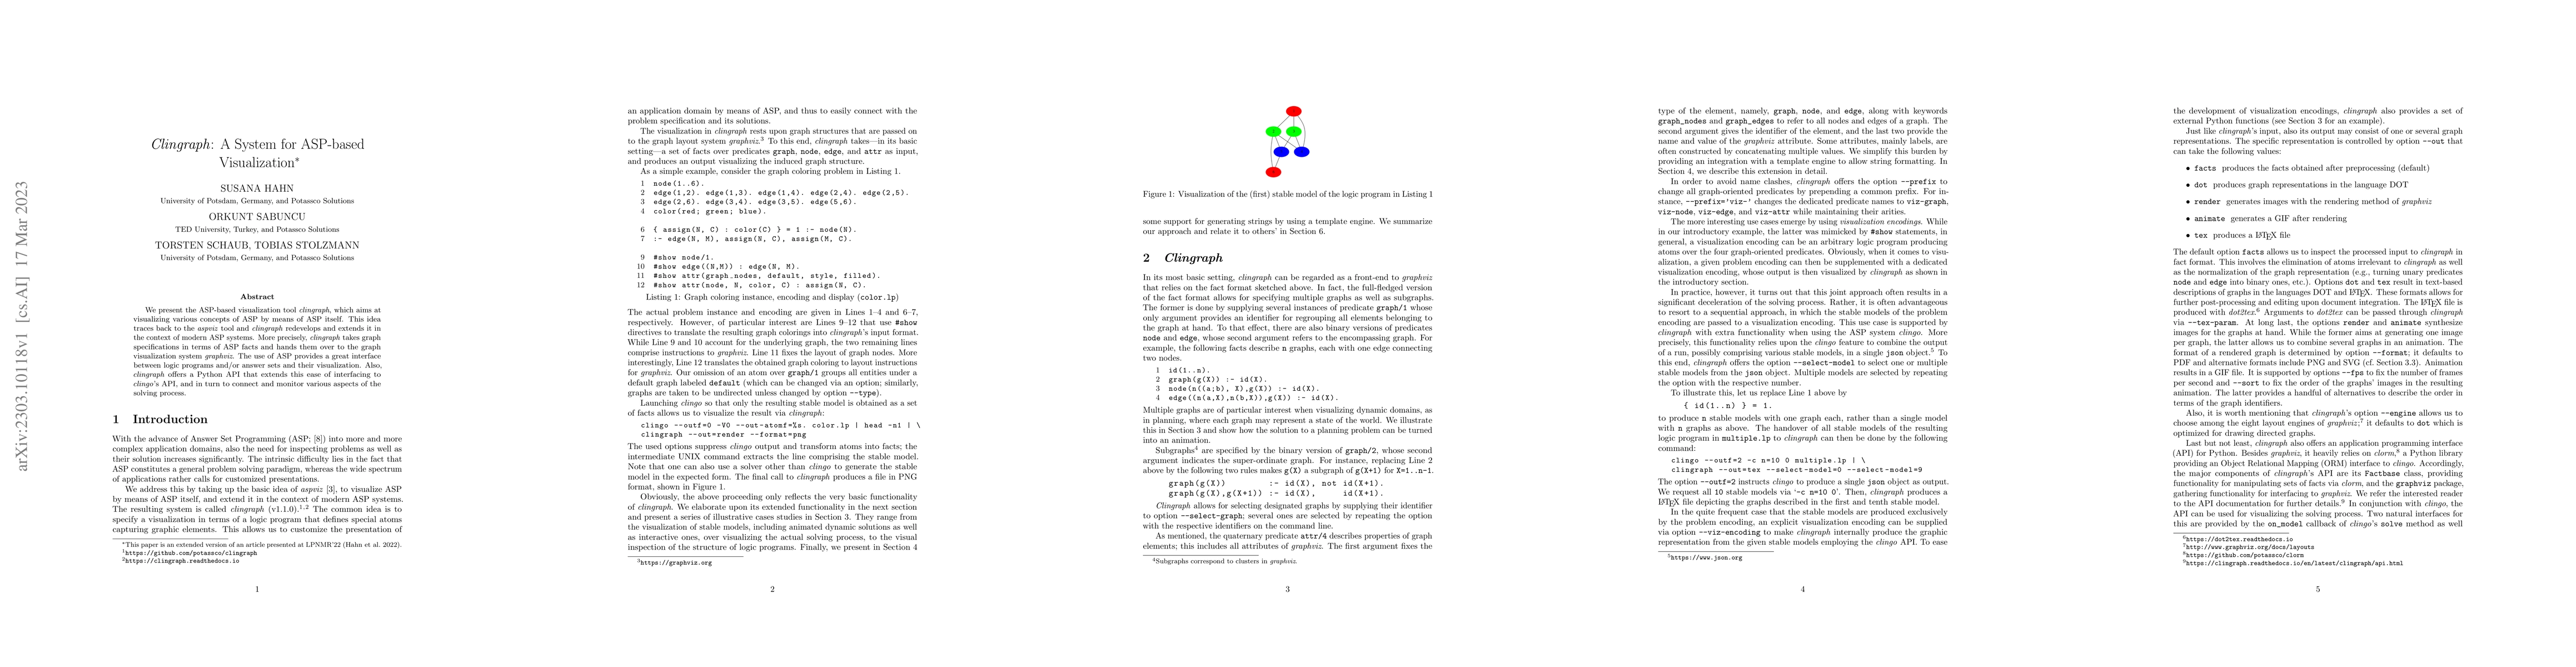
We present the ASP-based visualization tool, clingraph, which aims at visualizing various concepts of ASP by means of ASP itself. This idea traces back to the aspviz tool and clingraph redevelops and extends it in the context of modern ASP systems. More precisely, clingraph takes graph specifications in terms of ASP facts and hands them over to the graph visualization system graphviz. The use of ASP provides a great interface between logic programs and/or answer sets and their visualization. Also, clingraph offers a python API that extends this ease of interfacing to clingo's API, and in turn to connect and monitor various aspects of the solving process.
Source: OpenAlex · Snapshot
Seven facets of this paper, analysed and brought into focus by AI.
This research is important because it provides a powerful tool for visualizing answersets in ASP systems.
A combination of qualitative and quantitative methods was used to analyze the data.
This research is important because it provides a powerful tool for visualizing answersets in ASP systems.
The development of a powerful API that allows easy integration with custom projects.
This work is novel because it provides a unique combination of ASP technology and graph visualization software, making it a valuable tool for researchers and developers.
Current paper (gray), citations (green), references (blue)
Display is limited for performance on very large graphs.
Discussion 0