CO-SNE: Dimensionality Reduction and Visualization for Hyperbolic Data
Publication
Metrics
AI Quick Summary
CO-SNE extends t-SNE to hyperbolic space for dimensionality reduction and visualization, preserving hyperbolic data's inherent properties and distances to the origin. It outperforms traditional methods like PCA, t-SNE, UMAP, and HoroPCA in visualizing hyperbolic data.
Paper Preview
Abstract
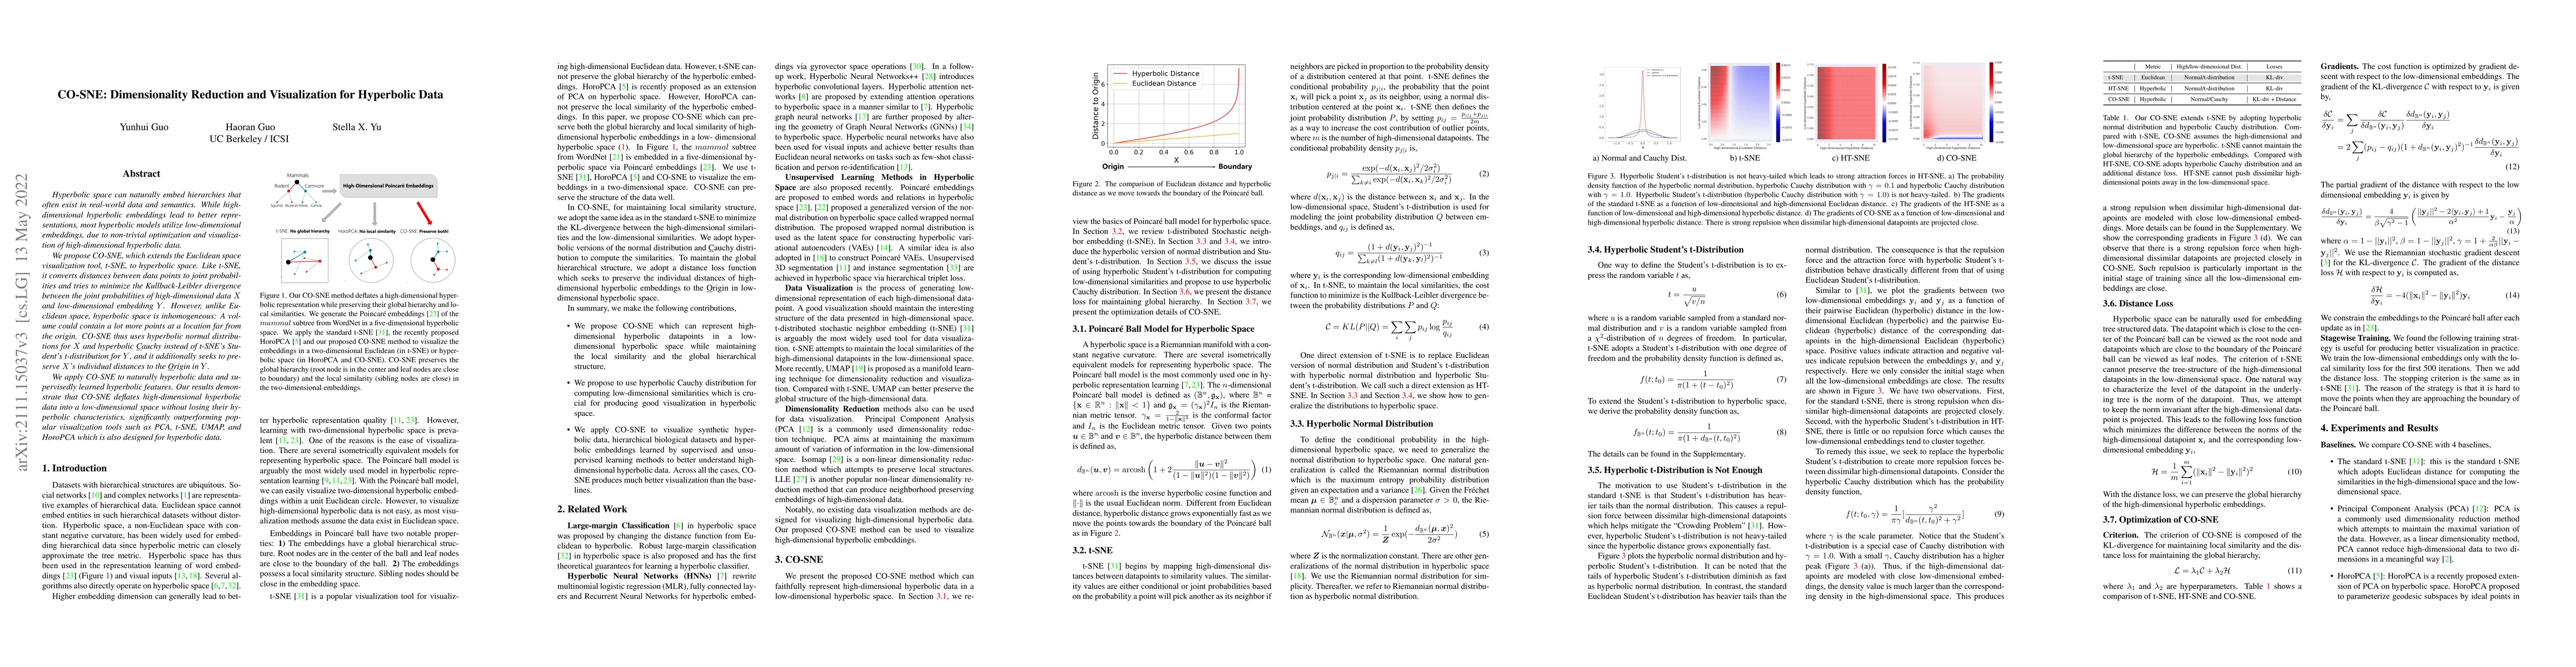
Hyperbolic space can naturally embed hierarchies that often exist in real-world data and semantics. While high-dimensional hyperbolic embeddings lead to better representations, most hyperbolic models utilize low-dimensional embeddings, due to non-trivial optimization and visualization of high-dimensional hyperbolic data. We propose CO-SNE, which extends the Euclidean space visualization tool, t-SNE, to hyperbolic space. Like t-SNE, it converts distances between data points to joint probabilities and tries to minimize the Kullback-Leibler divergence between the joint probabilities of high-dimensional data $X$ and low-dimensional embedding $Y$. However, unlike Euclidean space, hyperbolic space is inhomogeneous: A volume could contain a lot more points at a location far from the origin. CO-SNE thus uses hyperbolic normal distributions for $X$ and hyperbolic \underline{C}auchy instead of t-SNE's Student's t-distribution for $Y$, and it additionally seeks to preserve $X$'s individual distances to the \underline{O}rigin in $Y$. We apply CO-SNE to naturally hyperbolic data and supervisedly learned hyperbolic features. Our results demonstrate that CO-SNE deflates high-dimensional hyperbolic data into a low-dimensional space without losing their hyperbolic characteristics, significantly outperforming popular visualization tools such as PCA, t-SNE, UMAP, and HoroPCA which is also designed for hyperbolic data.
AI Key Findings
Get AI-generated insights about this paper's methodology, results, significance, and more — seven facets brought into focus.
Impact
Paper Details
Authors
PDF Preview
Key Terms
Citation Network
Current paper (gray), citations (green), references (blue)
Display is limited for performance on very large graphs.
Discussion 0