Comparing 2D and Augmented Reality Visualizations for Microservice System Understandability: A Controlled Experiment
Publication
Metrics
AI Quick Summary
This study compares 2D and augmented reality (AR) visualizations for understanding microservice systems, finding that AR helps novices detect service dependencies as effectively as experts, especially in large systems. No significant differences were found for service cardinality and bottlenecks identification.
Paper Preview
Abstract
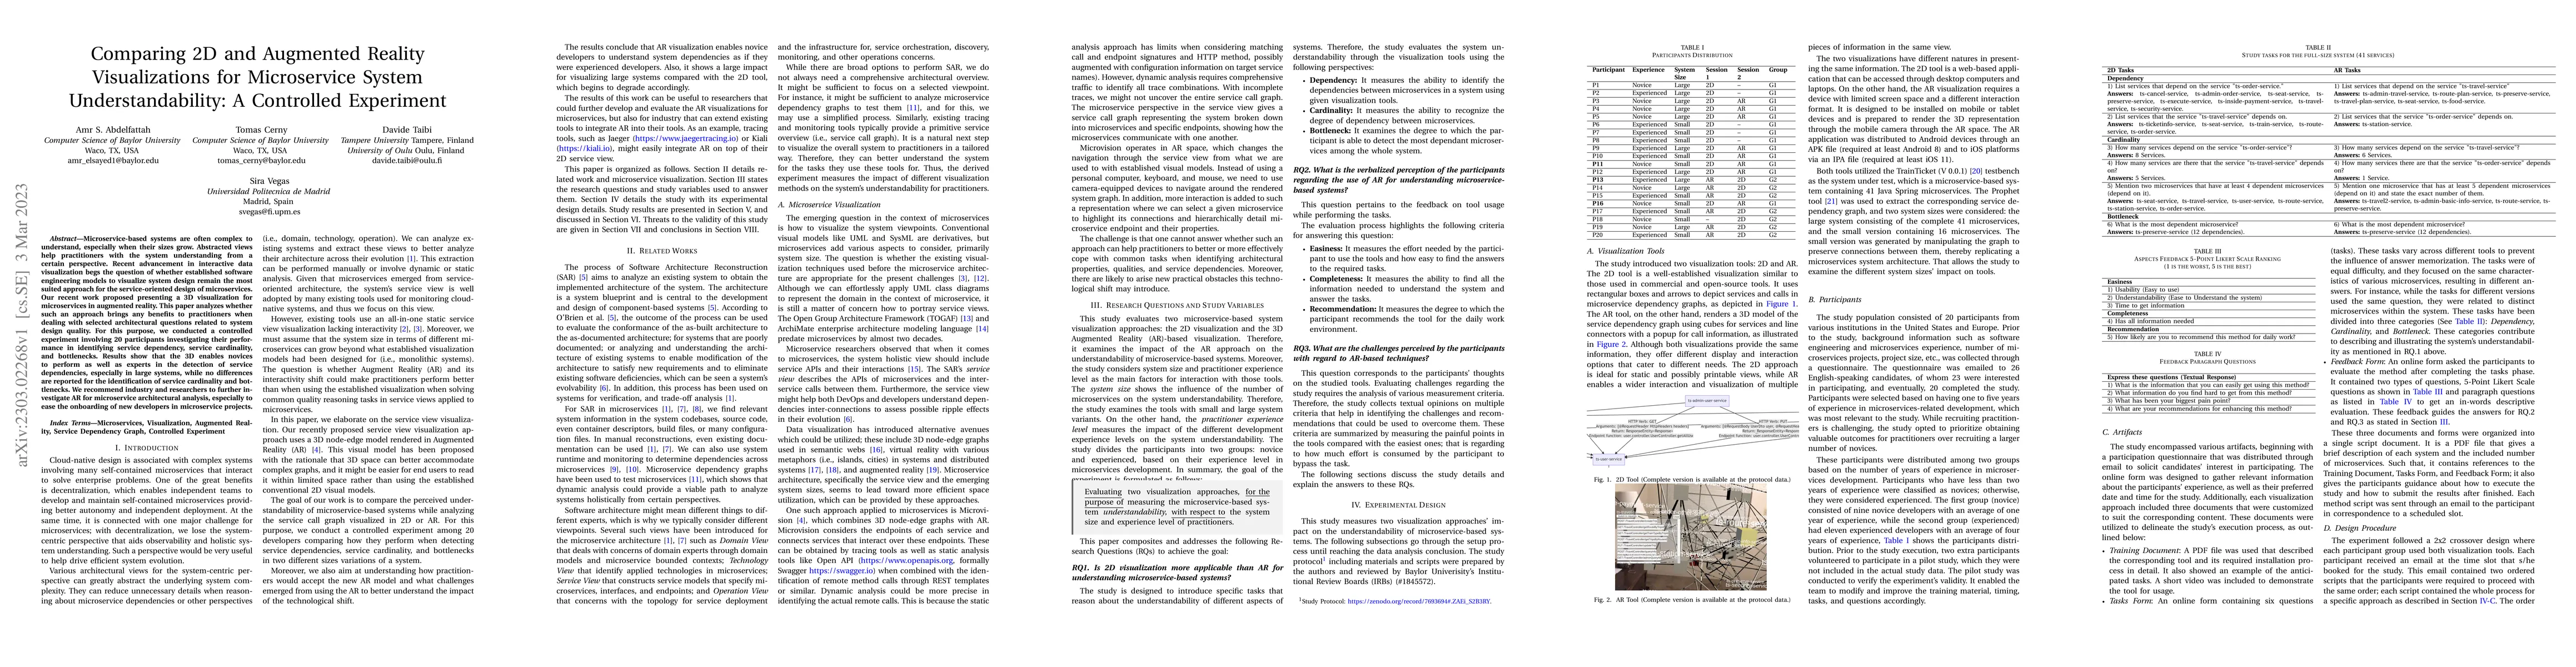
Microservice-based systems are often complex to understand, especially when their sizes grow. Abstracted views help practitioners with the system understanding from a certain perspective. Recent advancement in interactive data visualization begs the question of whether established software engineering models to visualize system design remain the most suited approach for the service-oriented design of microservices. Our recent work proposed presenting a 3D visualization for microservices in augmented reality. This paper analyzes whether such an approach brings any benefits to practitioners when dealing with selected architectural questions related to system design quality. For this purpose, we conducted a controlled experiment involving 20 participants investigating their performance in identifying service dependency, service cardinality, and bottlenecks. Results show that the 3D enables novices to perform as well as experts in the detection of service dependencies, especially in large systems, while no differences are reported for the identification of service cardinality and bottlenecks. We recommend industry and researchers to further investigate AR for microservice architectural analysis, especially to ease the onboarding of new developers in microservice~projects.
AI Key Findings
Get AI-generated insights about this paper's methodology, results, significance, and more — seven facets brought into focus.
Impact
Paper Details
Authors
PDF Preview
Key Terms
Citation Network
Current paper (gray), citations (green), references (blue)
Display is limited for performance on very large graphs.
Discussion 0