Computing and Graphing Probability Values of Pearson Distributions: A SAS/IML Macro
Publication
Metrics
Paper Preview
Abstract
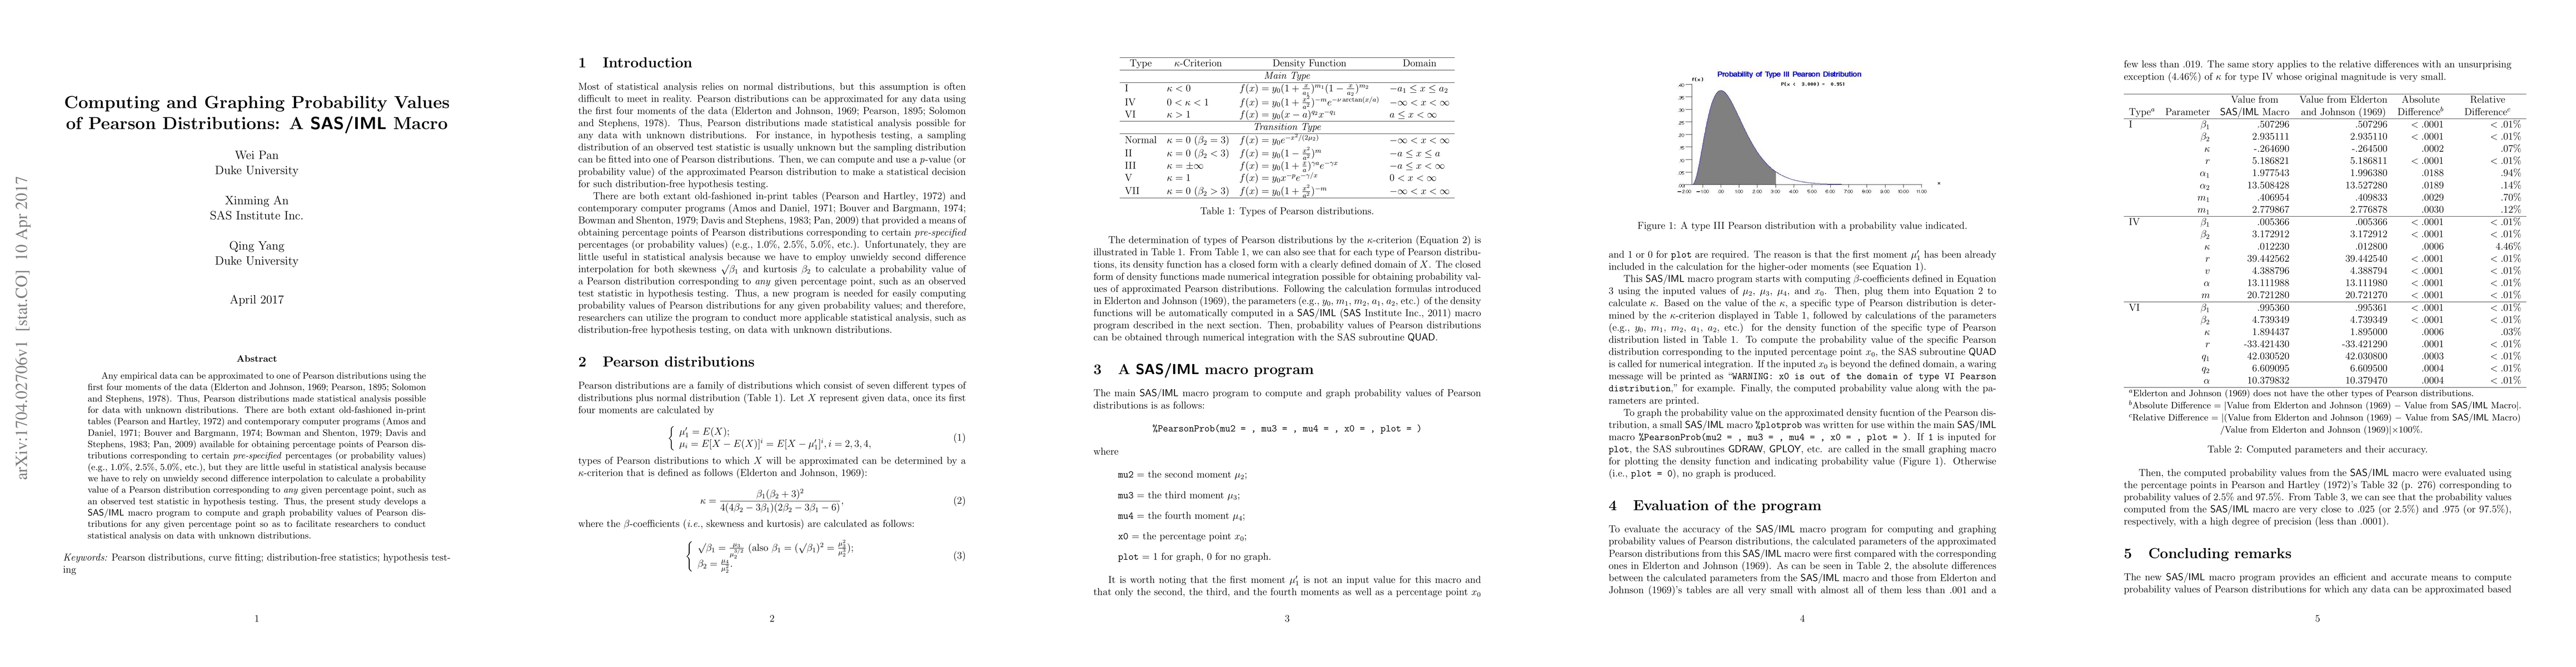
Any empirical data can be approximated to one of Pearson distributions using the first four moments of the data (Elderton and Johnson, 1969; Pearson, 1895; Solomon and Stephens, 1978). Thus, Pearson distributions made statistical analysis possible for data with unknown distributions. There are both extant old-fashioned in-print tables (Pearson and Hartley, 1972) and contemporary computer programs (Amos and Daniel, 1971; Bouver and Bargmann, 1974; Bowman and Shenton, 1979; Davis and Stephens, 1983; Pan, 2009) available for obtaining percentage points of Pearson distributions corresponding to certain pre-specifed percentages (or probability values) (e.g., 1.0%, 2.5%, 5.0%, etc.), but they are little useful in statistical analysis because we have to rely on unwieldy second difference interpolation to calculate a probability value of a Pearson distribution corresponding to any given percentage point, such as an observed test statistic in hypothesis testing. Thus, the present study develops a SAS/IML macro program to compute and graph probability values of Pearson distributions for any given percentage point so as to facilitate researchers to conduct statistical analysis on data with unknown distributions.
AI Key Findings
Get AI-generated insights about this paper's methodology, results, significance, and more — seven facets brought into focus.
Impact
Paper Details
Authors
PDF Preview
Key Terms
Citation Network
Current paper (gray), citations (green), references (blue)
Display is limited for performance on very large graphs.
Discussion 0