COVID19 Tracking: An Interactive Tracking, Visualizing and Analyzing Platform
Publication
Metrics
Paper Preview
Abstract
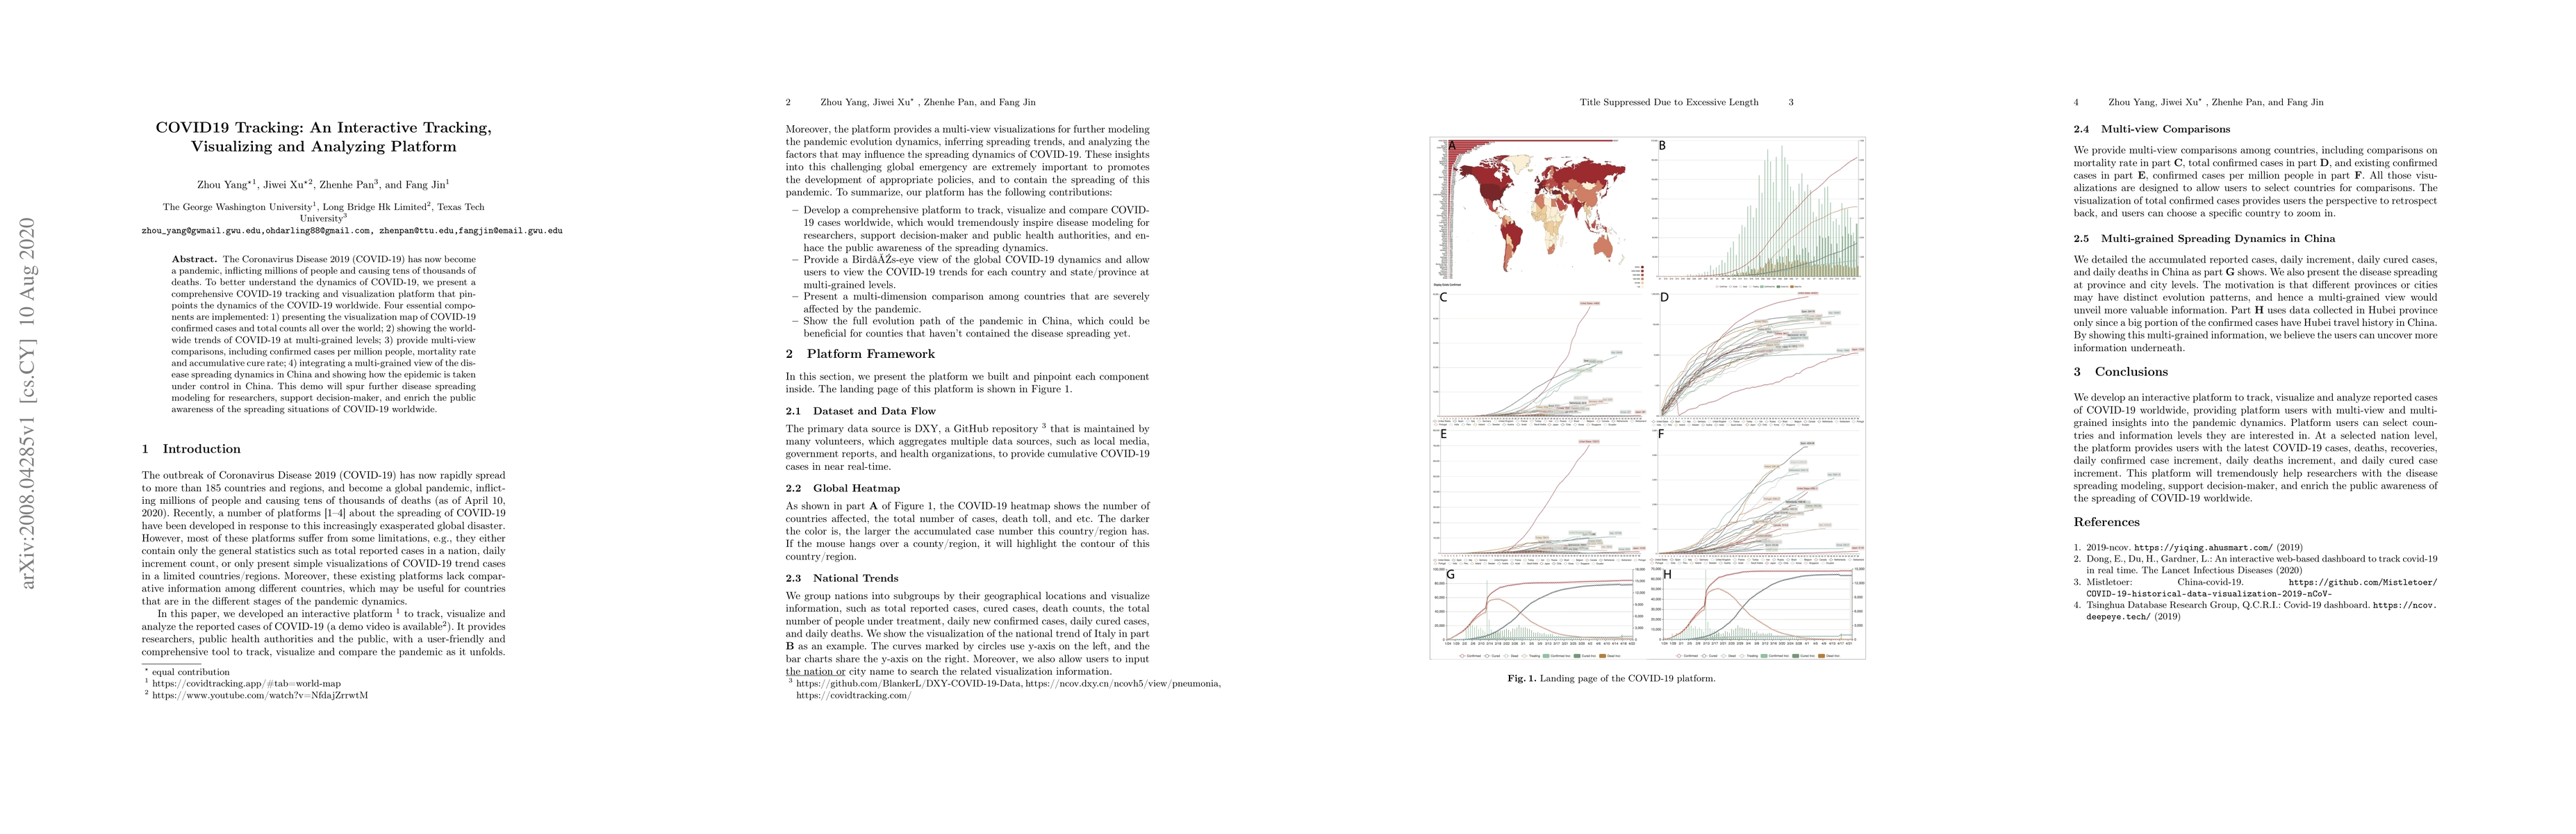
The Coronavirus Disease 2019 (COVID-19) has now become a pandemic, inflicting millions of people and causing tens of thousands of deaths. To better understand the dynamics of COVID-19, we present a comprehensive COVID-19 tracking and visualization platform that pinpoints the dynamics of the COVID-19 worldwide. Four essential components are implemented: 1) presenting the visualization map of COVID-19 confirmed cases and total counts all over the world; 2) showing the worldwide trends of COVID-19 at multi-grained levels; 3) provide multi-view comparisons, including confirmed cases per million people, mortality rate and accumulative cure rate; 4) integrating a multi-grained view of the disease spreading dynamics in China and showing how the epidemic is taken under control in China.
AI Key Findings
Get AI-generated insights about this paper's methodology, results, significance, and more — seven facets brought into focus.
Impact
Paper Details
Authors
PDF Preview
Key Terms
Citation Network
Current paper (gray), citations (green), references (blue)
Display is limited for performance on very large graphs.
Discussion 0