Data-driven vehicle speed detection from synthetic driving simulator images
Publication
Metrics
AI Quick Summary
This paper explores using synthetic driving simulator images to develop a learning-based approach for vehicle speed detection, addressing the challenge of data collection. It compares CNN-GRU and 3D-CNN regression models, showing promising preliminary results for this data-driven method.
Paper Preview
Abstract
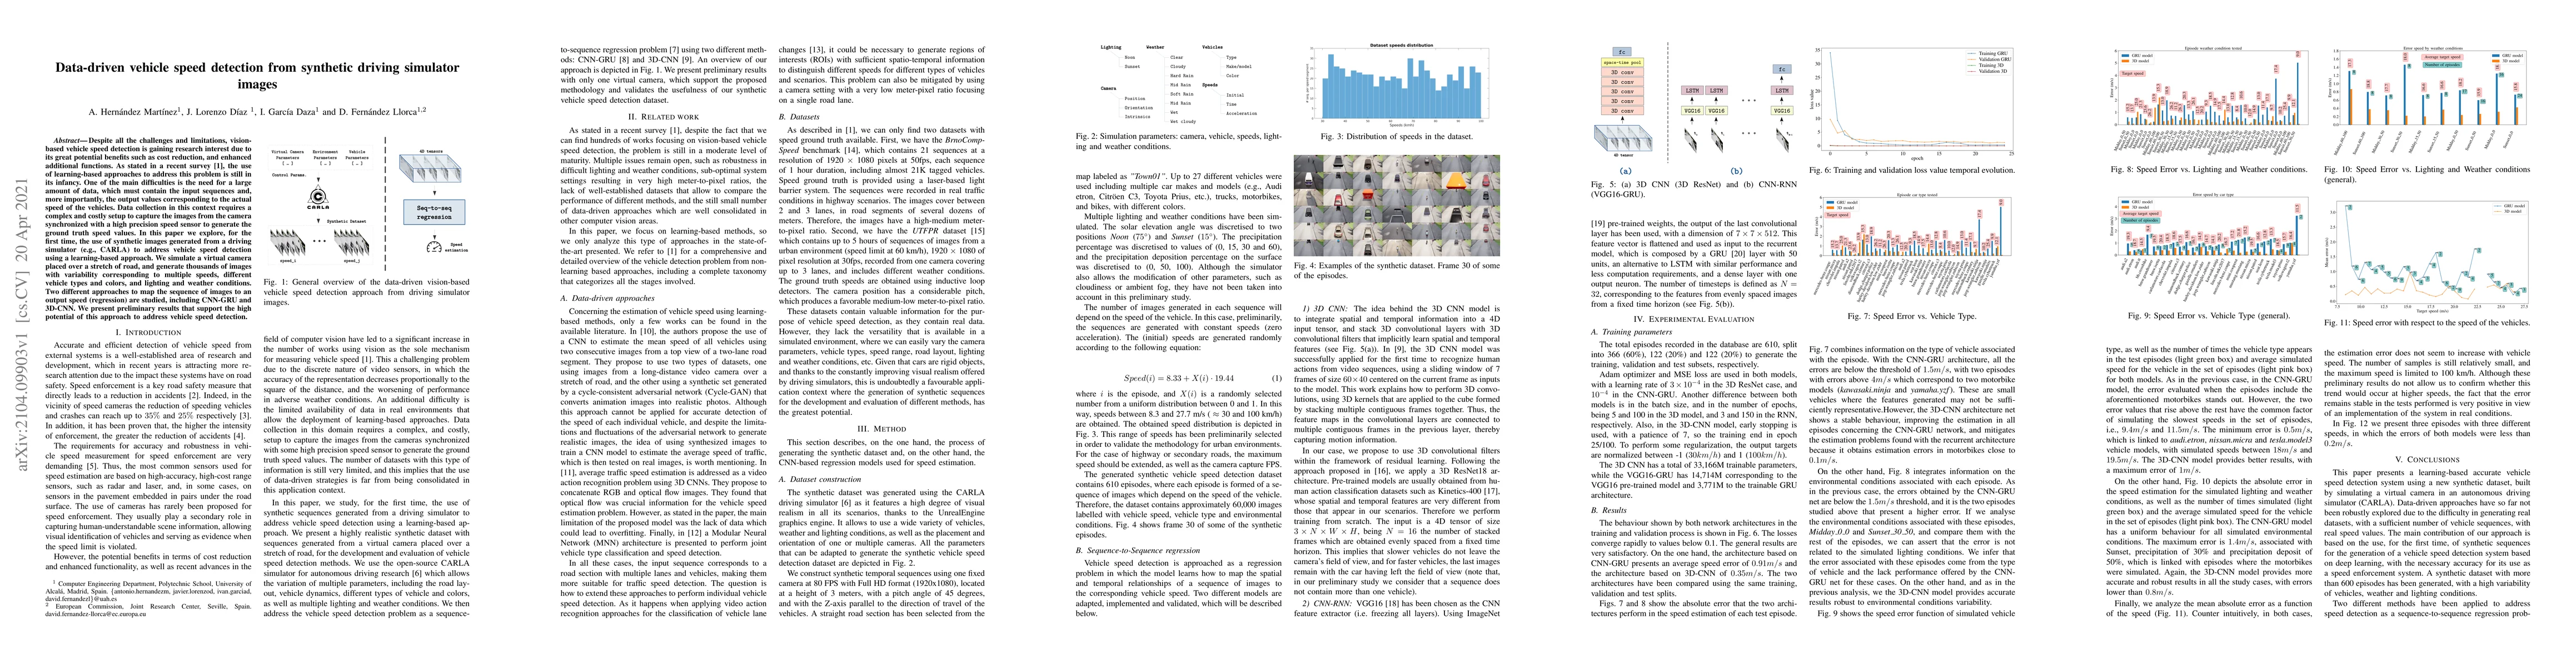
Despite all the challenges and limitations, vision-based vehicle speed detection is gaining research interest due to its great potential benefits such as cost reduction, and enhanced additional functions. As stated in a recent survey [1], the use of learning-based approaches to address this problem is still in its infancy. One of the main difficulties is the need for a large amount of data, which must contain the input sequences and, more importantly, the output values corresponding to the actual speed of the vehicles. Data collection in this context requires a complex and costly setup to capture the images from the camera synchronized with a high precision speed sensor to generate the ground truth speed values. In this paper we explore, for the first time, the use of synthetic images generated from a driving simulator (e.g., CARLA) to address vehicle speed detection using a learning-based approach. We simulate a virtual camera placed over a stretch of road, and generate thousands of images with variability corresponding to multiple speeds, different vehicle types and colors, and lighting and weather conditions. Two different approaches to map the sequence of images to an output speed (regression) are studied, including CNN-GRU and 3D-CNN. We present preliminary results that support the high potential of this approach to address vehicle speed detection.
AI Key Findings
Get AI-generated insights about this paper's methodology, results, significance, and more — seven facets brought into focus.
Impact
Paper Details
Authors
PDF Preview
Key Terms
Citation Network
Current paper (gray), citations (green), references (blue)
Display is limited for performance on very large graphs.
Discussion 0