Detecting Layout Templates in Complex Multiregion Files
Publication
Metrics
AI Quick Summary
The paper proposes the Mondrian approach to automatically detect layout templates in complex multiregion spreadsheets by rendering files as images, clustering elements to form regions, and comparing layout graphs. The method outperforms existing table recognition algorithms in identifying region boundaries and recurring layouts across multiple files.
Paper Preview
Abstract
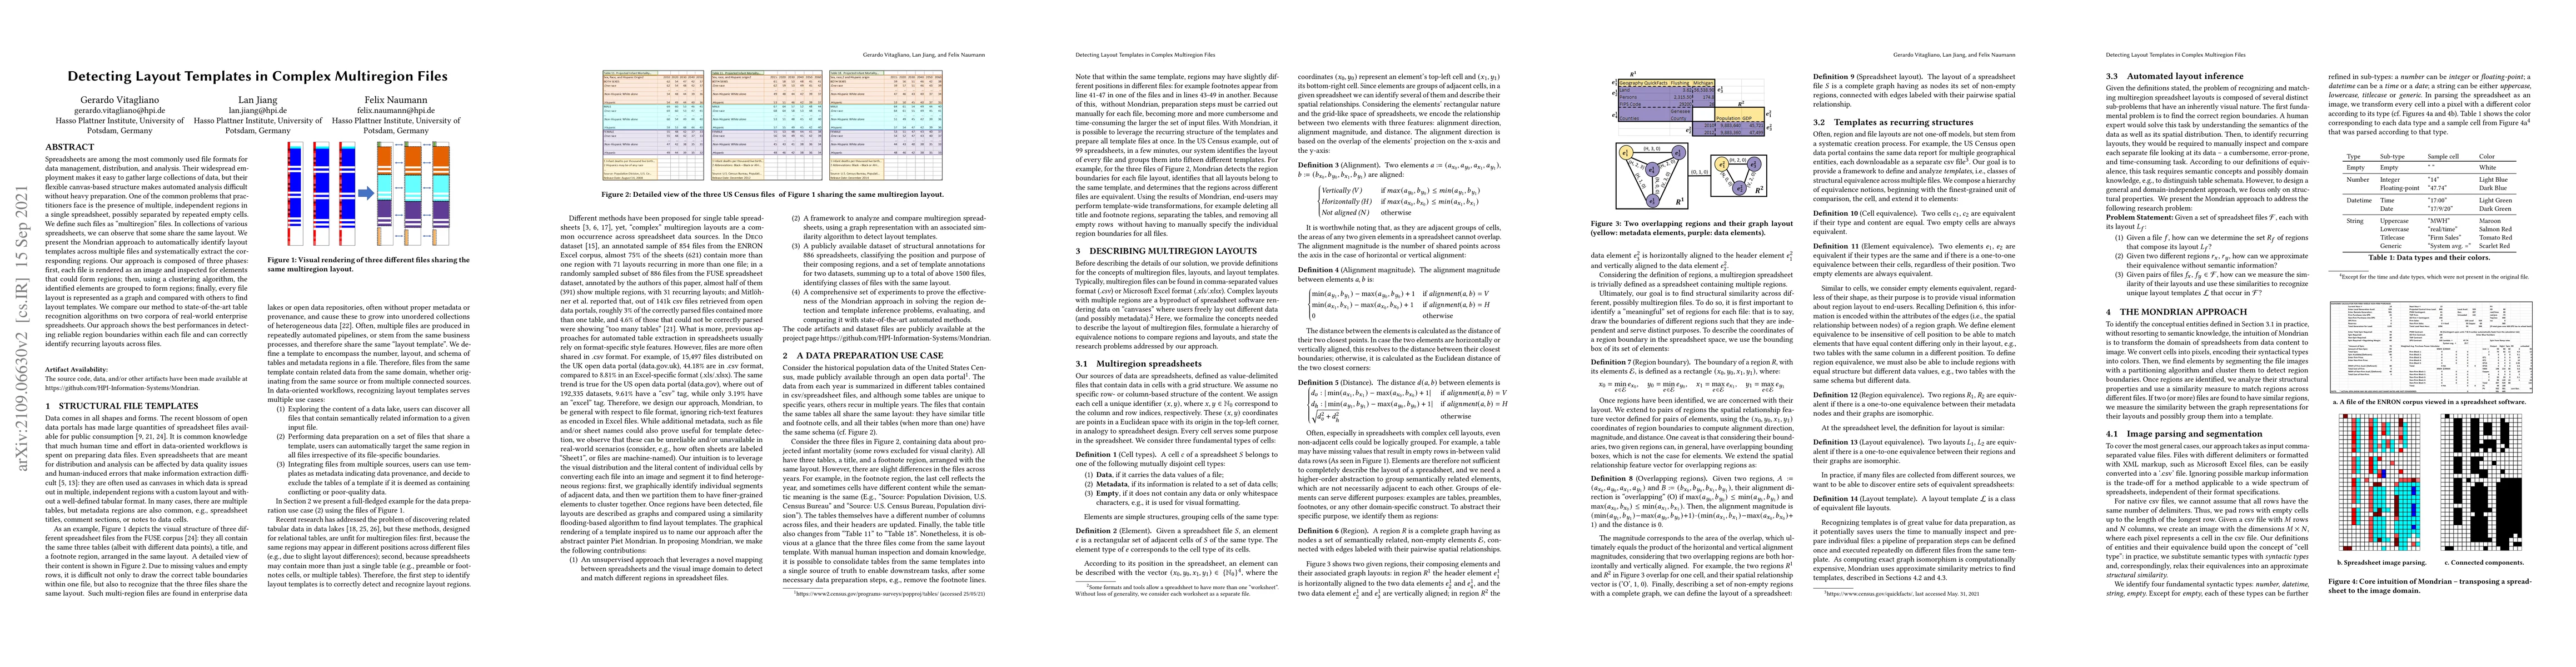
Spreadsheets are among the most commonly used file formats for data management, distribution, and analysis. Their widespread employment makes it easy to gather large collections of data, but their flexible canvas-based structure makes automated analysis difficult without heavy preparation. One of the common problems that practitioners face is the presence of multiple, independent regions in a single spreadsheet, possibly separated by repeated empty cells. We define such files as "multiregion" files. In collections of various spreadsheets, we can observe that some share the same layout. We present the Mondrian approach to automatically identify layout templates across multiple files and systematically extract the corresponding regions. Our approach is composed of three phases: first, each file is rendered as an image and inspected for elements that could form regions; then, using a clustering algorithm, the identified elements are grouped to form regions; finally, every file layout is represented as a graph and compared with others to find layout templates. We compare our method to state-of-the-art table recognition algorithms on two corpora of real-world enterprise spreadsheets. Our approach shows the best performances in detecting reliable region boundaries within each file and can correctly identify recurring layouts across files.
AI Key Findings
Get AI-generated insights about this paper's methodology, results, significance, and more — seven facets brought into focus.
Impact
Paper Details
Authors
PDF Preview
Key Terms
Citation Network
Current paper (gray), citations (green), references (blue)
Display is limited for performance on very large graphs.
Discussion 0