Publication
Metrics
AI Quick Summary
This research introduces a computational framework using 2-point spatial correlations and PCA to statistically quantify and represent dislocation networks, aiding in the design of materials with desired mechanical properties.
Paper Preview
Abstract
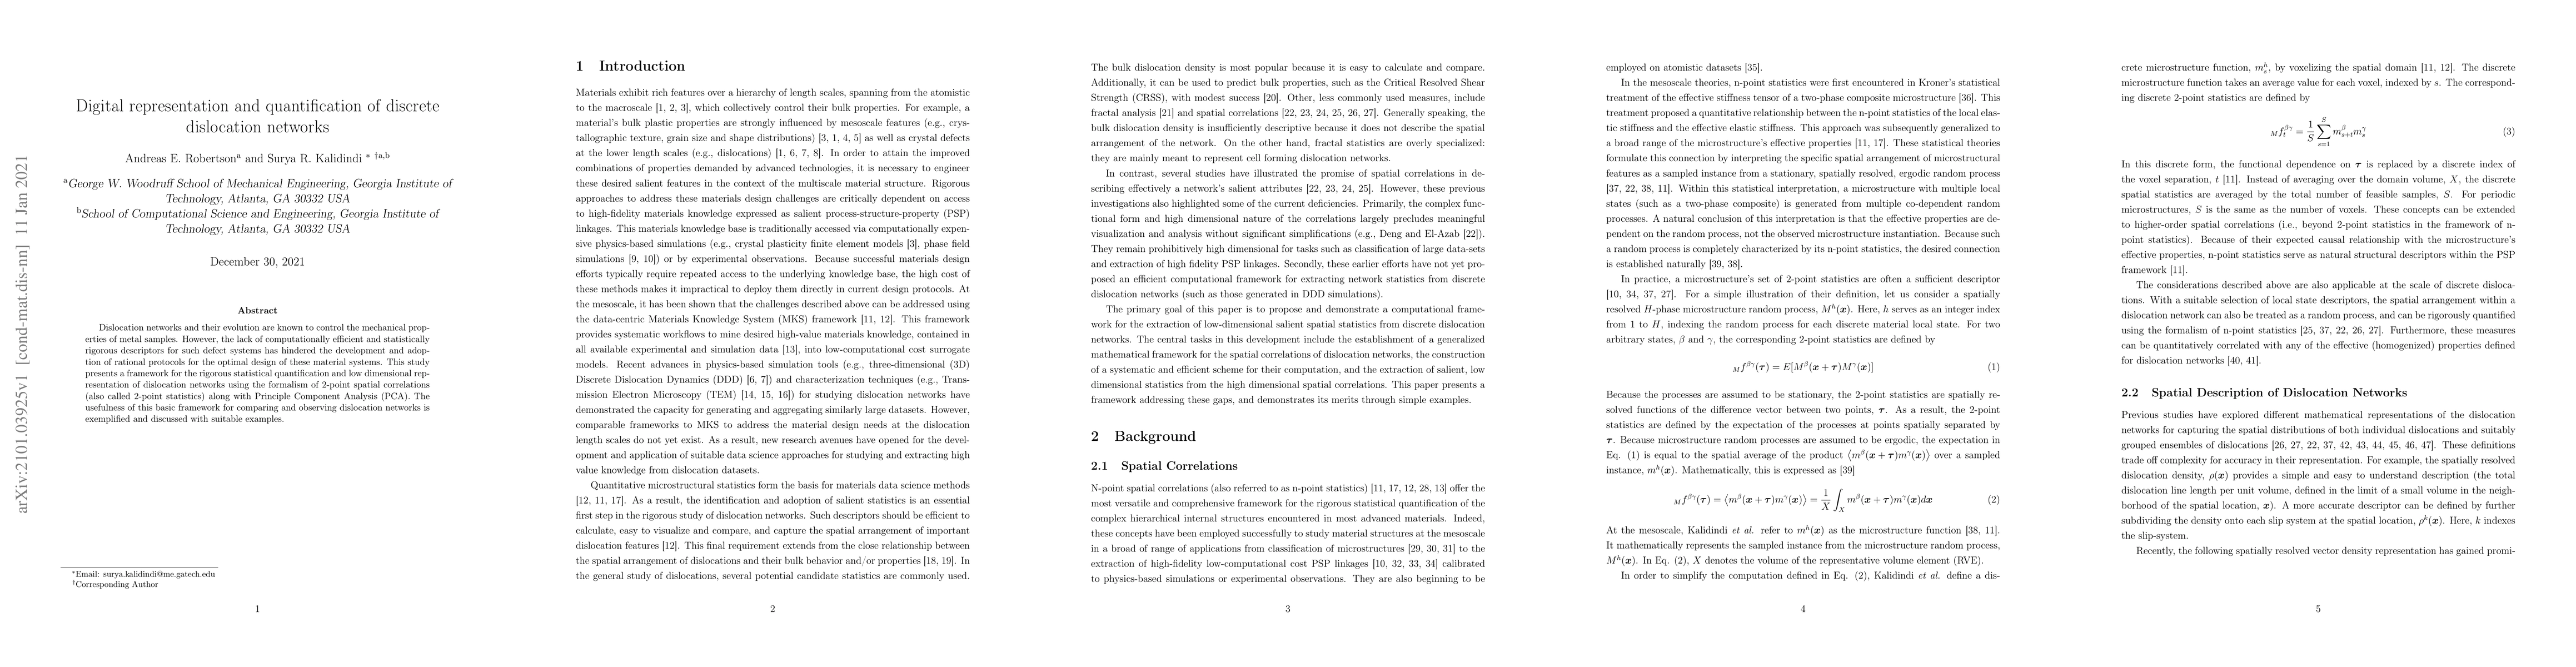
Dislocation networks and their evolution are known to control the mechanical properties of metal samples. However, the lack of computationally efficient and statistically rigorous descriptors for such defect systems has hindered the development and adoption of rational protocols for the optimal design of these material systems. This study presents a framework for the rigorous statistical quantification and low dimensional representation of dislocation networks using the formalism of 2-point spatial correlations (also called 2-point statistics) along with Principle Component Analysis (PCA). The usefulness of this basic framework for comparing and observing dislocation networks is exemplified and discussed with suitable examples.
AI Key Findings
Get AI-generated insights about this paper's methodology, results, significance, and more — seven facets brought into focus.
Impact
Paper Details
Authors
PDF Preview
Key Terms
Citation Network
Current paper (gray), citations (green), references (blue)
Display is limited for performance on very large graphs.
Discussion 0