Publication
Metrics
AI Quick Summary
This paper introduces a method to incorporate elastic measures into t-SNE and UMAP for dimensionality reduction, addressing the geometry of functional data. The approach improves shape identification performance on benchmark datasets, achieving notable F1 scores.
Paper Preview
Abstract
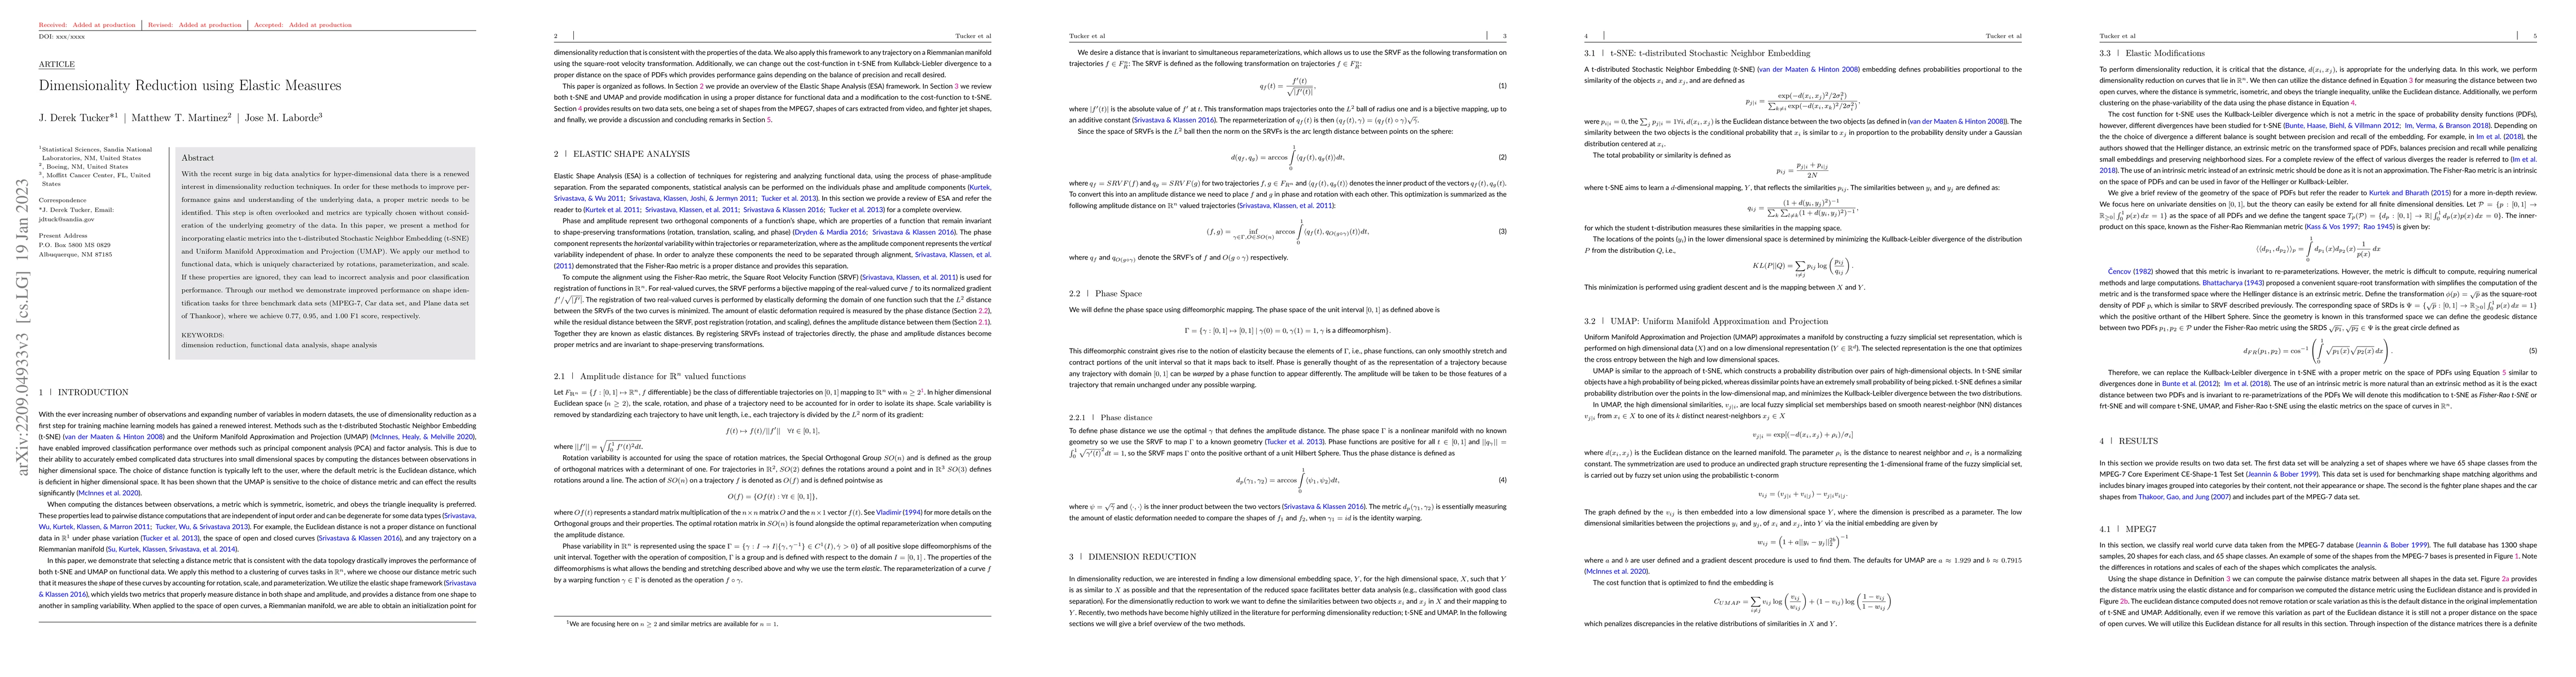
With the recent surge in big data analytics for hyper-dimensional data there is a renewed interest in dimensionality reduction techniques for machine learning applications. In order for these methods to improve performance gains and understanding of the underlying data, a proper metric needs to be identified. This step is often overlooked and metrics are typically chosen without consideration of the underlying geometry of the data. In this paper, we present a method for incorporating elastic metrics into the t-distributed Stochastic Neighbor Embedding (t-SNE) and Uniform Manifold Approximation and Projection (UMAP). We apply our method to functional data, which is uniquely characterized by rotations, parameterization, and scale. If these properties are ignored, they can lead to incorrect analysis and poor classification performance. Through our method we demonstrate improved performance on shape identification tasks for three benchmark data sets (MPEG-7, Car data set, and Plane data set of Thankoor), where we achieve 0.77, 0.95, and 1.00 F1 score, respectively.
AI Key Findings
Get AI-generated insights about this paper's methodology, results, significance, and more — seven facets brought into focus.
Impact
Paper Details
Authors
PDF Preview
Key Terms
Citation Network
Current paper (gray), citations (green), references (blue)
Display is limited for performance on very large graphs.
Discussion 0