Publication
Metrics
Quick Actions
Paper Preview
Abstract
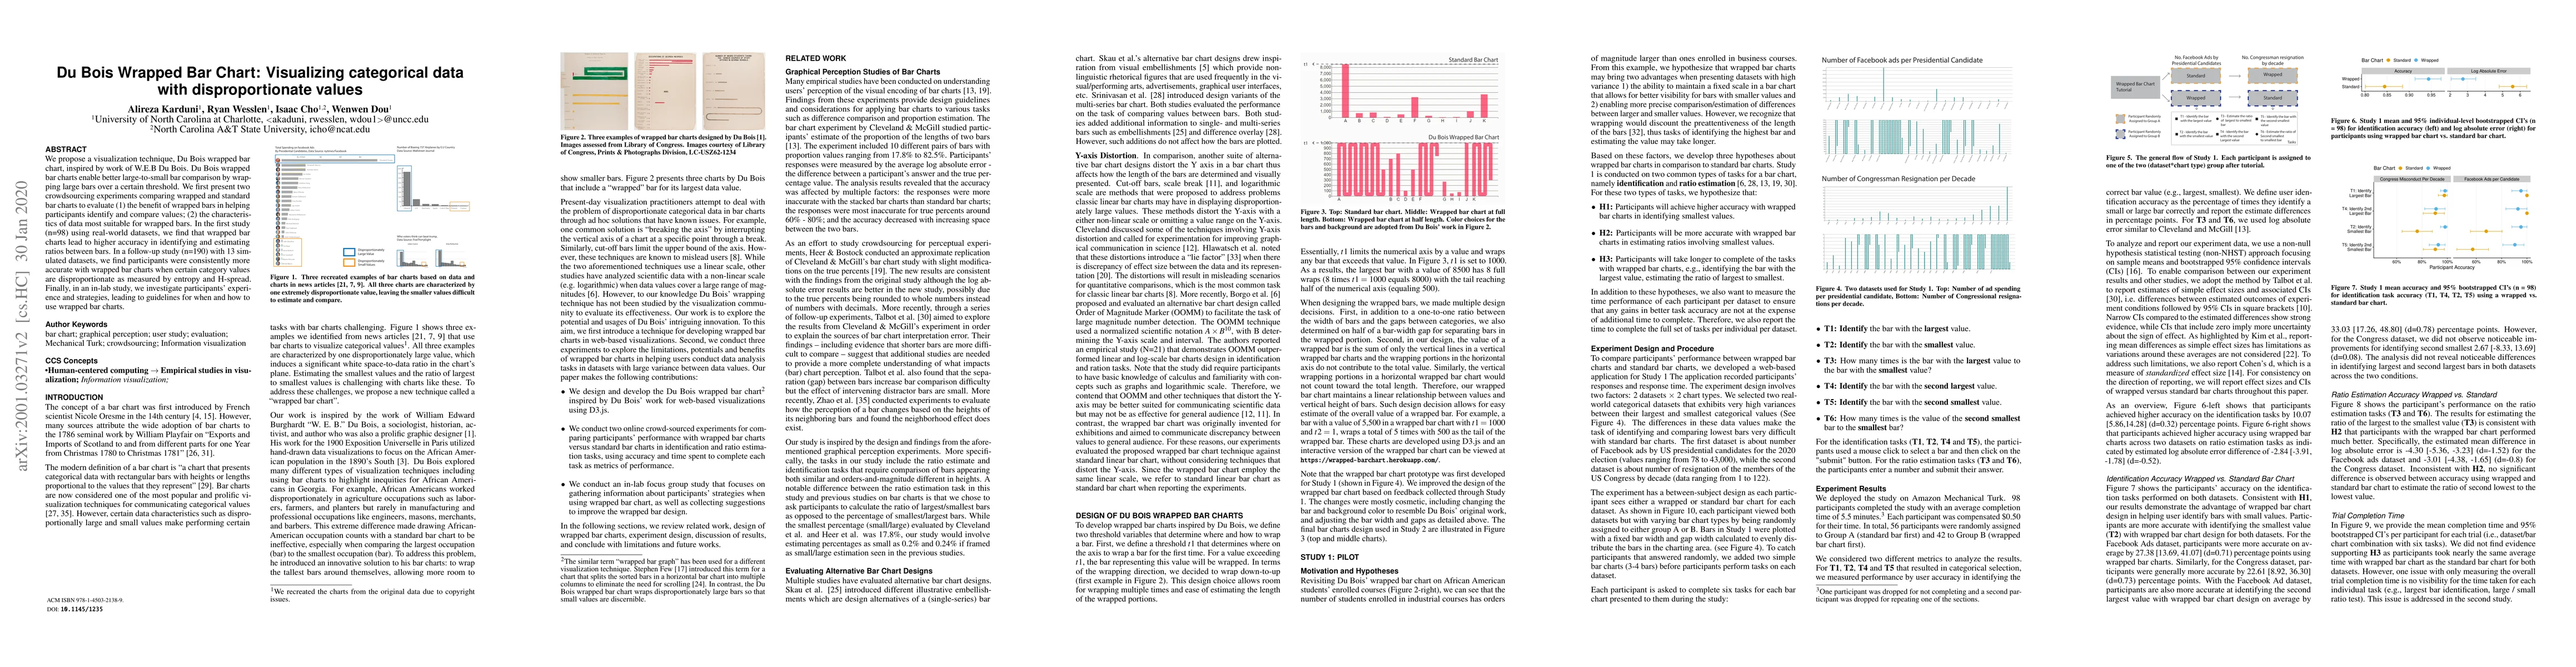
We propose a visualization technique, Du Bois wrapped bar chart, inspired by work of W.E.B Du Bois. Du Bois wrapped bar charts enable better large-to-small bar comparison by wrapping large bars over a certain threshold. We first present two crowdsourcing experiments comparing wrapped and standard bar charts to evaluate (1) the benefit of wrapped bars in helping participants identify and compare values; (2) the characteristics of data most suitable for wrapped bars. In the first study (n=98) using real-world datasets, we find that wrapped bar charts lead to higher accuracy in identifying and estimating ratios between bars. In a follow-up study (n=190) with 13 simulated datasets, we find participants were consistently more accurate with wrapped bar charts when certain category values are disproportionate as measured by entropy and H-spread. Finally, in an in-lab study, we investigate participants' experience and strategies, leading to guidelines for when and how to use wrapped bar charts.
AI Key Findings
Get AI-generated insights about this paper's methodology, results, and significance.
Paper Details
How to Cite This Paper
@article{anon2020du,
  title         = {Du Bois Wrapped Bar Chart: Visualizing categorical data with
  disproportionate values},
  year          = {2020},
  eprint        = {2001.03271},
  archivePrefix = {arXiv},
  primaryClass  = {cs.HC},
}(2020). Du Bois Wrapped Bar Chart: Visualizing categorical data with
disproportionate values. arXiv. https://arxiv.org/abs/2001.03271"Du Bois Wrapped Bar Chart: Visualizing categorical data with
disproportionate values." arXiv, 2020, arxiv.org/abs/2001.03271.PDF Preview
Key Terms
Citation Network
Current paper (gray), citations (green), references (blue)
Display is limited for performance on very large graphs.
Similar Papers
Found 4 papersPure subrings of Du Bois singularities are Du Bois singularities
Charles Godfrey, Takumi Murayama
| Title | Authors | Year | Actions |
|---|
Comments (0)