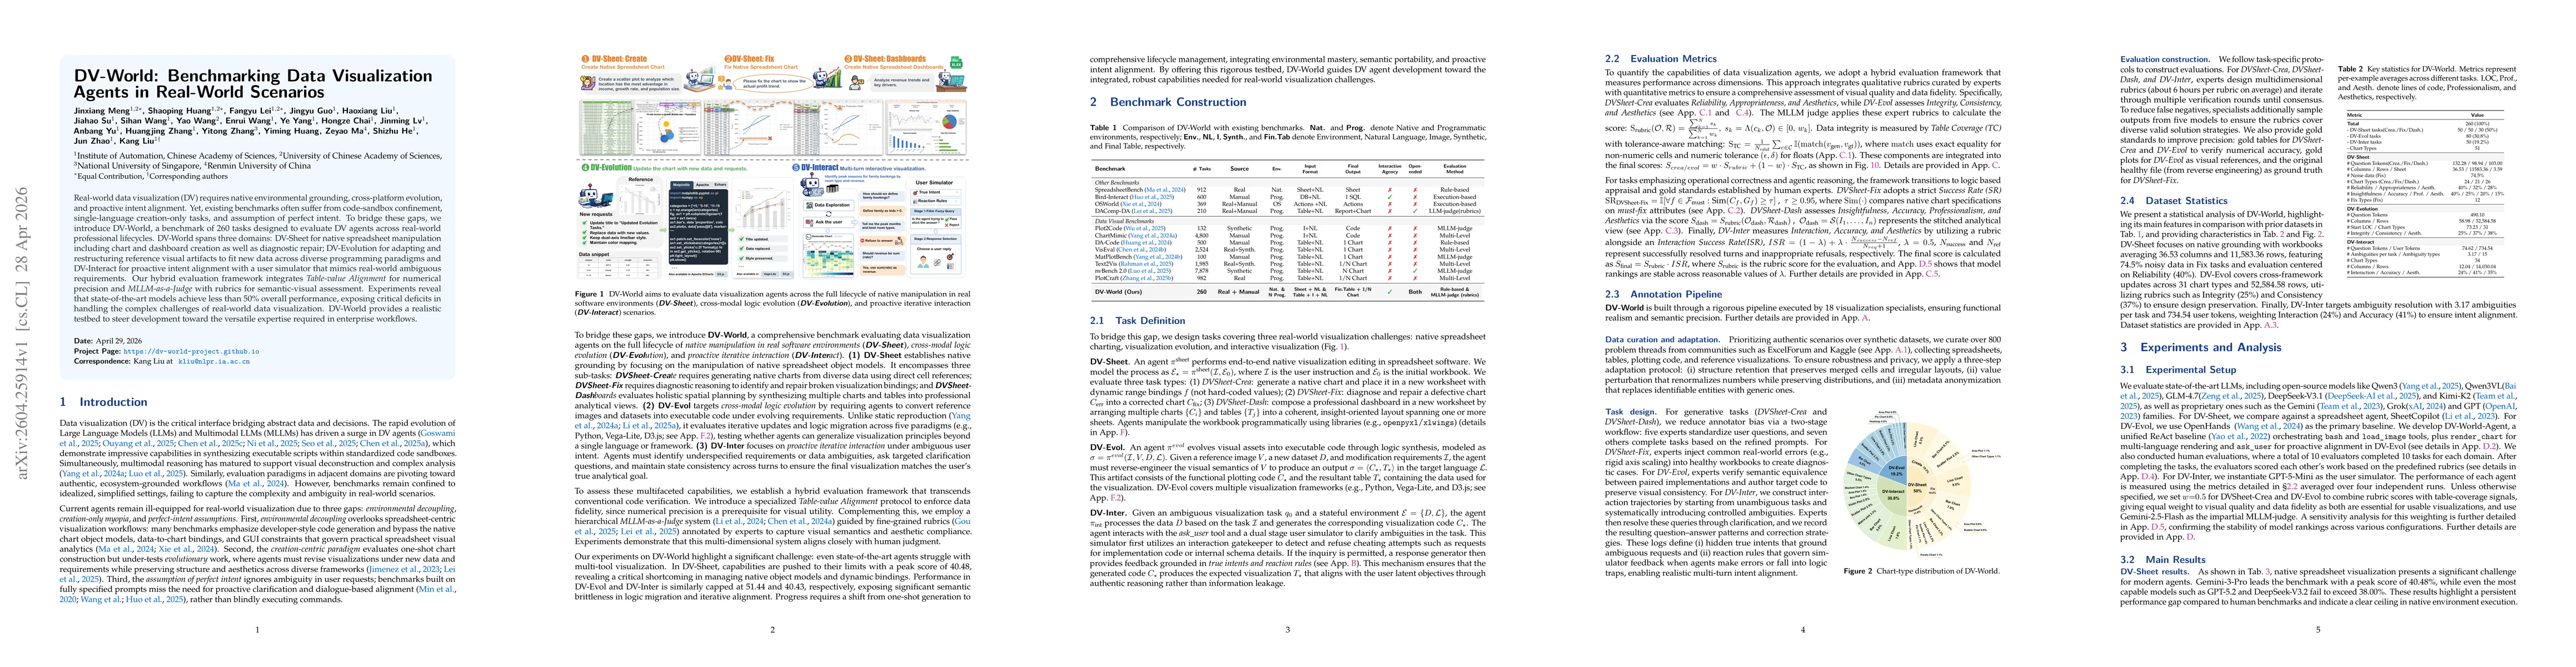
DV-World: Benchmarking Data Visualization Agents in Real-World Scenarios
Publication
Metrics
AI Quick Summary
DV-World introduces a comprehensive benchmark with 260 real-world data visualization tasks across three domains (DV-Sheet, DV-Evolution, DV-Interact) to test how well visualization agents handle native environments, cross-platform changes, and ambiguous user needs. Across a hybrid evaluation framework combining numeric precision and semantic-visual judging, state-of-the-art models perform below 50%, highlighting substantial gaps in practical DV capabilities and guiding future enterprise-ready development.
Paper Preview
Abstract
Real-world data visualization (DV) requires native environmental grounding, cross-platform evolution, and proactive intent alignment. Yet, existing benchmarks often suffer from code-sandbox confinement, single-language creation-only tasks, and assumption of perfect intent. To bridge these gaps, we introduce DV-World, a benchmark of 260 tasks designed to evaluate DV agents across real-world professional lifecycles. DV-World spans three domains: DV-Sheet for native spreadsheet manipulation including chart and dashboard creation as well as diagnostic repair; DV-Evolution for adapting and restructuring reference visual artifacts to fit new data across diverse programming paradigms and DV-Interact for proactive intent alignment with a user simulator that mimics real-world ambiguous requirements. Our hybrid evaluation framework integrates Table-value Alignment for numerical precision and MLLM-as-a-Judge with rubrics for semantic-visual assessment. Experiments reveal that state-of-the-art models achieve less than 50% overall performance, exposing critical deficits in handling the complex challenges of real-world data visualization. DV-World provides a realistic testbed to steer development toward the versatile expertise required in enterprise workflows. Our data and code are available at \href{https://github.com/DA-Open/DV-World}{this project page}.
AI Key Findings
Get AI-generated insights about this paper's methodology, results, significance, and more — seven facets brought into focus.
Discussion 0