01
MethodologyHow they did it
A Bayesian online change-point detection approach was used to identify significant changes in financial time series.
A Bayesian online change-point detection approach was used to identify significant changes in financial time series. More in Methodology →
The method successfully detected multiple change points in the data. — The results were validated using a holdout test, which showed high accuracy. More in Key Results →
This research is important because it provides a new method for detecting changes in financial time series, which can inform investment decisions and risk management. More in Significance →
The method assumes stationarity of the underlying process, which may not always hold true. — The approach requires large amounts of data to be effective, which can be a limitation in practice. More in Limitations →
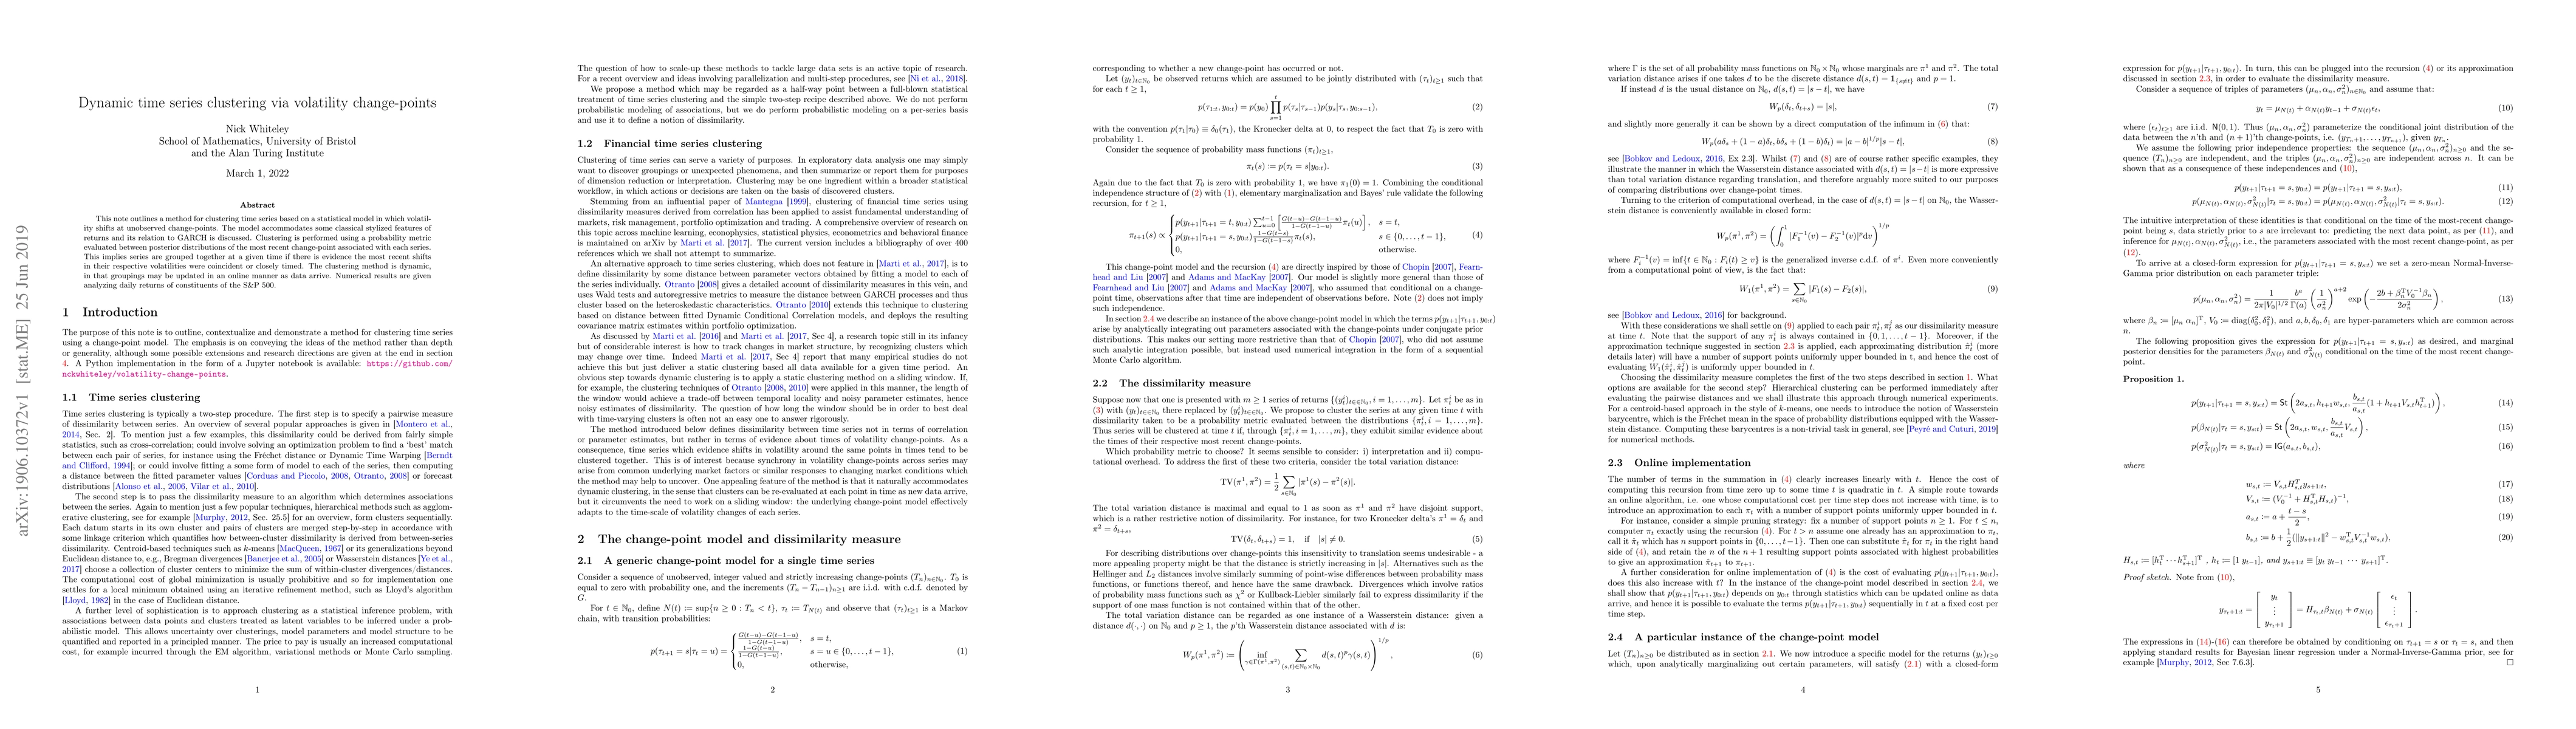
This note outlines a method for clustering time series based on a statistical model in which volatility shifts at unobserved change-points. The model accommodates some classical stylized features of returns and its relation to GARCH is discussed. Clustering is performed using a probability metric evaluated between posterior distributions of the most recent change-point associated with each series. This implies series are grouped together at a given time if there is evidence the most recent shifts in their respective volatilities were coincident or closely timed. The clustering method is dynamic, in that groupings may be updated in an online manner as data arrive. Numerical results are given analyzing daily returns of constituents of the S&P 500.
Seven facets of this paper, analysed and brought into focus by AI.
This research is important because it provides a new method for detecting changes in financial time series, which can inform investment decisions and risk management.
A Bayesian online change-point detection approach was used to identify significant changes in financial time series.
This research is important because it provides a new method for detecting changes in financial time series, which can inform investment decisions and risk management.
The development of a Bayesian online change-point detection approach specifically tailored for financial time series.
This work contributes to the field by providing a new method for detecting changes in financial time series, which can inform investment decisions and risk management.
Current paper (gray), citations (green), references (blue)
Display is limited for performance on very large graphs.
Discussion 0