Publication
Metrics
Paper Preview
Abstract
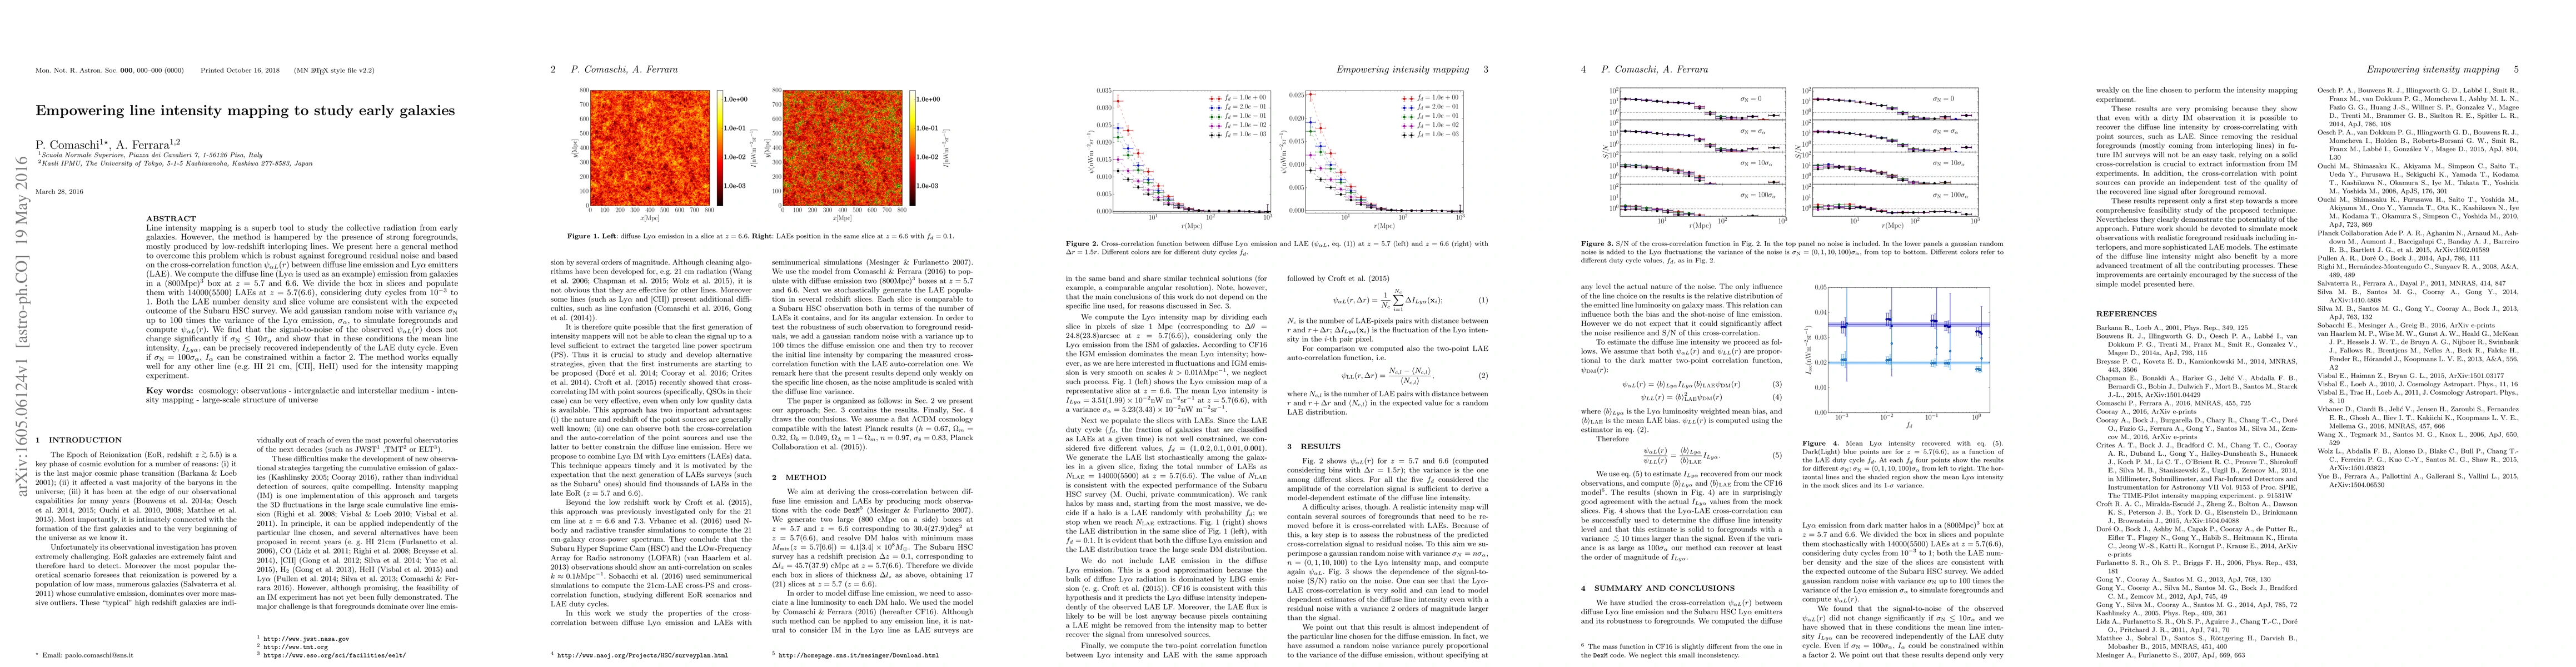
Line intensity mapping is a superb tool to study the collective radiation from early galaxies. However, the method is hampered by the presence of strong foregrounds, mostly produced by low-redshift interloping lines. We present here a general method to overcome this problem which is robust against foreground residual noise and based on the cross-correlation function $\psi_{\alpha L}(r)$ between diffuse line emission and Ly$\alpha$ emitters (LAE). We compute the diffuse line (Ly$\alpha$ is used as an example) emission from galaxies in a $(800{\rm Mpc})^3$ box at $z = 5.7$ and $6.6$. We divide the box in slices and populate them with $14000(5500)$ LAEs at $z = 5.7(6.6)$, considering duty cycles from $10^{-3}$ to $1$. Both the LAE number density and slice volume are consistent with the expected outcome of the Subaru HSC survey. We add gaussian random noise with variance $\sigma_{\rm N}$ up to 100 times the variance of the Ly$\alpha$ emission, $\sigma_\alpha$, to simulate foregrounds and compute $\psi_{\alpha L}(r)$. We find that the signal-to-noise of the observed $\psi_{\alpha L}(r)$ does not change significantly if $\sigma_{\rm N} \le 10 \sigma_\alpha$ and show that in these conditions the mean line intensity, $I_{Ly\alpha}$, can be precisely recovered independently of the LAE duty cycle. Even if $\sigma_{\rm N} = 100 \sigma_\alpha$, $I_\alpha$ can be constrained within a factor $2$. The method works equally well for any other line (e.g. HI 21 cm, [CII], HeII) used for the intensity mapping experiment.
AI Key Findings
Get AI-generated insights about this paper's methodology, results, significance, and more — seven facets brought into focus.
Impact
Paper Details
PDF Preview
Key Terms
Citation Network
Current paper (gray), citations (green), references (blue)
Display is limited for performance on very large graphs.
Discussion 0